Lupin is a Mumbai-based generic and branded-generic drugmaker founded in 1968 by the late Dr Desh Bandhu Gupta. It sells in more than 100 markets from 15 manufacturing sites. By prescriptions it is the third-largest generics company in the US, and it ranks eighth in the Indian pharmaceutical market. It holds the number-one position in anti-TB drugs in India and is among the top three in respiratory, cardiology and diabetes. The founding family holds 46.85% of the equity.
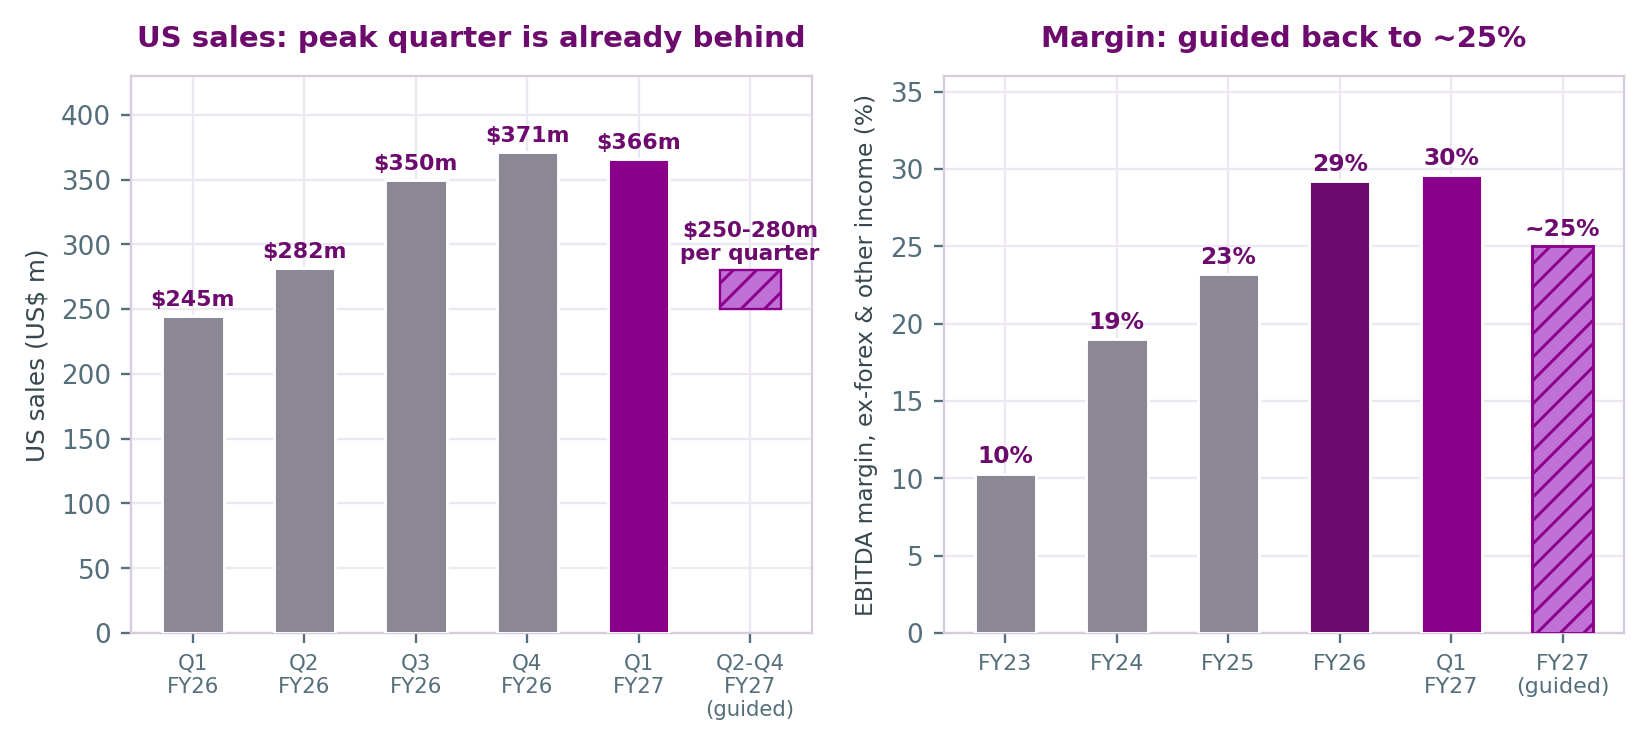
FY26 (year to March 2026) was the best year in the company's history. Sales rose 23.9% to ₹27,488 crore. US sales rose 46% to US$1,318 million, and reported profit after tax rose 62% to ₹5,355 crore. Most of the jump came from a few limited-competition US launches, principally generic Jynarque (tolvaptan), generic Myrbetriq (mirabegron) and generic Spiriva (tiotropium). PL Capital estimates that these three products made up about half of FY26 EPS. Q1 FY27 was stronger still, with record sales of ₹8,217 crore, US sales of $366 million and an EBITDA margin near 30%.
Management then guided the rest of the year down. Apotex, Teva and a third new entrant are launching tolvaptan from Q2, and mirabegron prices are falling. US sales are guided at $250–280 million a quarter for Q2–Q4, which is 23–32% below Q1. Full-year US sales are guided at $1.1–1.2 billion, against $1.318 billion in FY26. Group EBITDA margin is guided at about 25%, against roughly 30% in FY26 on a like-for-like basis. The stock has fallen 17% since the Q1 results, from ₹2,364 on 7 August to ₹1,956 on 9 October, close to its 52-week low of ₹1,900.
Our rating is SELL, though the margin is narrow. On our base case, FY27 EPS falls about 18% to around ₹95, so the stock trades at roughly 20x forward earnings rather than the 15x the screens show. The ex-US business is genuinely strong and the balance sheet holds net cash. The issue is price: today's level already assumes that pegfilgrastim, apixaban and the inhalation pipeline replace the lost exclusivities on schedule. Our P/E method gives ₹2,073 and our DCF gives ₹1,552, and the average of the two is ₹1,810. The Street consensus of about ₹2,500 is well above both.
| Segment (₹ crore) | FY25 | FY26 | YoY | % of FY26 | Q1 FY27 | YoY |
|---|---|---|---|---|---|---|
| United States | 7,998 | 11,678 | +46.0% | 42% | 3,435 | +42.9% |
| India | 7,577 | 8,114 | +7.1% | 30% | 2,380 | +13.9% |
| Other developed markets (Europe, Canada, Australia) | 2,864 | 3,244 | +13.3% | 12% | 1,149 | +48.3% |
| Emerging markets | 2,576 | 3,483 | +35.2% | 13% | 990 | +51.7% |
| API | 1,177 | 969 | −17.7% | 4% | 264 | +8.5% |
| Total product sales | 22,192 | 27,488 | +23.9% | 100% | 8,217 | +33.3% |
Source: Lupin press releases dated 7 May 2026 and 6 August 2026. Total product sales exclude other operating income (₹471cr in FY26). Percentages are as reported and may not add to 100 because of rounding. Q1 FY27 US sales of ₹3,435cr equal US$366m.
How the money is made. Lupin runs two different businesses under one name. The first is US generics, which earns most of the profit swings. It has 149 marketed products, holds first place in 56 of them and is in the top three in 112. Most of this is a commodity business where prices fall every year. The returns come from the small number of launches that face little competition, either because they are hard to make (inhalers, long-acting injectables) or because Lupin filed first and won 180 days of exclusivity. The second is branded generics in India and emerging markets, built around chronic therapies. Chronic drugs were 67% of the India portfolio in Q1 FY27, and the company is targeting 70% within five years. This business grows steadily and depends on doctor relationships through a field force of about 11,300, including roughly 8,700 medical representatives. It is not exposed to US price erosion.
Moat: real in places, absent in others.
| Metric | Value | Read |
|---|---|---|
| Revenue CAGR, FY23–FY26 | 18.9% | ₹16,642cr → ₹27,958cr; the 10-year CAGR is only 7% |
| EBITDA margin path | 10% → 19% → 23% → 29% | FY23 to FY26, excluding forex and other income |
| FY27 margin guidance | ~25% | About 1.5 points of the drop is attributed to "adjacency losses" |
| FCF conversion (FCF / PAT) | 103% FY26; 41% FY25; 141% FY24 | CFO ₹7,334cr and FCF ₹5,527cr in FY26 |
| ROCE vs WACC | 29.9% vs ~11.5%* | Narrows to roughly 18–19% pre-tax on our FY27 base case |
| Net cash | ₹2,831cr (Jun 2026) | Down from ₹4,636cr in March after the VISUfarma purchase |
| R&D intensity | 7.5% FY26; ~8% FY27 guided | About 70% goes to complex products (injectables, inhalation, biosimilars) |
| Working capital | 87 → 90 days | Inventory days of 303 (screener, FY26) are high even by generics standards |
*WACC of 11.5% is a Dart Consultants assumption, not a sourced figure. ROCE is screener.in's current figure; ICRA reports debt/OPBDITA of 0.8x, gearing of 0.3x and interest cover of 20.3x for FY26.
Margins. The rise from 10% to 29% over three years is real, but most of it is product mix rather than cost discipline. Gross margin rose from 69.2% in FY25 to 73.3% in FY26 and 74.6% in Q1 FY27 as tolvaptan and mirabegron sales grew. Employee costs and other expenses fell only modestly as a share of sales. When those products lose pricing, gross margin should give back much of the gain. Management's ~25% guidance implies about 23% on average for Q2–Q4. ICRA's own expectation is 22–25% over the near-to-medium term.
Cash flow. This is the strongest part of the story. FY26 operating cash flow was ₹7,334 crore, 137% of PAT, and free cash flow was ₹5,527 crore after capex. That paid for the €190 million (about ₹1,970 crore) VISUfarma purchase with cash on hand, and still left net cash. ICRA puts FY27 capex at ₹3,500–4,000 crore including VISUfarma, and FY28 capex at ₹1,000–1,500 crore. Management has also said it is looking for a further $200–300 million of specialty M&A.
Returns. ROCE of 29.9% is the highest among the six large Indian pharma names we compared. On our FY27 base case (EBITDA ₹7,549cr, D&A of about ₹1,800cr), EBIT falls to about ₹5,750cr on capital employed of about ₹29,000–31,000 crore. That is a pre-tax ROCE of 18–19%, or about 14% after tax, still above our assumed 11.5% WACC but by a much smaller margin than the trailing number suggests.
Near-term catalysts (6–12 months)
Longer-term catalysts (2–3 years)
Lupin is a large-cap listed on the NSE and BSE and falls under the full SEBI LODR framework. Because 42% of its sales are in the US, the US FDA is effectively a second regulator. Its inspection outcomes (Form 483, VAI, OAI, warning letter) affect revenue directly. US antitrust exposure falls under the Department of Justice and civil courts in Pennsylvania. In India, drug pricing is governed by the NLEM and the DPCO.
Promoter holding has been essentially unchanged: 46.94% in December 2024 and 46.85% in June 2026, with the only small changes coming from ESOP dilution. We found no pledge disclosures in the sources we reviewed. The board has a strong international independent bench. As of the most recent list we found (2024), it included Jean-Luc Bélingard, Mark McDade, Jeffrey Kindler, K.B.S. Anand, Punita Kumar Sinha and Alfonso Zulueta. We did not re-verify the 2026 composition. In 2026 the company cleared two FDA sites to VAI status, Somerset and Ankleshwar, after Form 483s. It disclosed the antitrust provisions and settlements through exchange filings as they occurred. ICRA reaffirmed its A1+ rating in July 2026, and CRISIL gave an ESG score of 69 ("Strong") in August 2026.
Management is a family arrangement. Vinita Gupta has been CEO since 2013, Nilesh Gupta is Managing Director, and their mother, Manju Gupta, is non-executive chair. This is common in Indian pharma, but it means the founder's children run both the operating side and the board. Q1 FY27 tax rose to 29.8% from 13.7% a year earlier, and we did not find a full explanation in the sources we reviewed. The nature of the Q4 FY26 exceptional charge of ₹131 crore is also undisclosed in the material we saw. Mutual-fund ownership fell from 18.0% to 14.8% between December 2025 and June 2026, while FII ownership rose from 21.5% to 22.4%. This may simply be rotation, but domestic funds were net sellers during the strongest quarters in the company's history.
None new, but some long-standing issues remain open. Two US FDA warning letters are still unresolved, at Tarapur and Mandideep, and Pithampur is classified OAI (per ICRA, July 2026). ICRA notes that none of these sites carries a material US pipeline, which limits the damage. Remediation at Pithampur Unit II is described as on track. The Nagpur injectables site received six observations in September 2025. Its status matters because Nagpur is relevant to the injectables pipeline management is relying on. Lupin is also part of the DoJ's long-running price-fixing investigation. It denies the allegations, but booked a provision in Q3 FY26 and agreed two further settlements in April–May 2026.
The inspection outcome at Nagpur and the next inspections at Pithampur; whether the antitrust provisions need topping up; the nature of the Q4 FY26 exceptional item; any equity or debt financing for the $200–300 million specialty acquisition; and the board's succession arrangements beyond the current generation.
Sound, with regulatory and legal issues that are recurring rather than one-off. Ownership is stable, disclosure is timely and the balance sheet is conservative. Nothing we found suggests aggressive accounting. The cost shows up elsewhere: ₹558 crore of exceptional charges in FY26, mostly antitrust, more settlements in early FY27, and two warning letters that have now been open for years. Neither changes the investment case, but both are real costs and should not be treated as one-offs.
Multiples against peers. All prices are 9 October 2026 closes from screener.in. Trailing P/E and ROCE are screener's figures. P/S is market cap divided by FY26 sales. Lupin's forward multiples use our base case. We could not consistently source peer net debt, so we have not built a peer EV/EBITDA comparison and show Lupin's own only. We also could not find a reliable source for Lupin's historical average forward P/E, so we do not quote one. The longer record is worth noting, though. Over ten years Lupin's profit grew at a 10% CAGR while its share price grew at 3%. The market has watched a US-led earnings peak unwind before: PAT of ₹2,565cr in FY17 fell to ₹258cr in FY18, and the company made losses in FY20 and FY22.
| Company | Mcap (₹cr) | P/E TTM | P/S (FY26) | FY26 OPM | ROCE | 3-yr sales CAGR |
|---|---|---|---|---|---|---|
| Lupin | 89,469 | 15.0x | 3.2x | 29% | 29.9% | 19% |
| Sun Pharma | 4,22,283 | 33.4x | 7.2x | 28% | 20.5% | 10% |
| Zydus Lifesciences | 1,11,471 | 22.9x | 4.1x | 31% | 21.1% | 16% |
| Cipla | 1,05,104 | 29.4x | 3.7x | 21% | 15.5% | 7% |
| Dr Reddy's | 99,911 | 31.0x | 3.0x | 19% | 13.0% | 11% |
| Aurobindo | 97,411 | 25.8x | 2.9x | 20% | 12.9% | 11% |
| Lupin multiples at ₹1,956 | Trailing | FY27E (Dart base) | FY28E (Dart base) |
|---|---|---|---|
| P/E | 15.0x (TTM EPS ₹121) | 20.6x (EPS ₹95.1) | 19.8x (EPS ₹98.7) |
| EV/EBITDA (EV ~₹86,638cr) | 9.1x (TTM ₹9,538cr) | 11.5x (₹7,549cr) | 11.2x (₹7,768cr) |
| P/S | 3.0x (TTM ₹29,967cr) | 3.0x (₹30,195cr) | 2.8x (₹31,704cr) |
EV is market cap less net cash of ₹2,831cr (June 2026). Forward estimates are Dart Consultants' own, built from management guidance and described below. For comparison, Axis Direct's FY27E/FY28E EPS is ₹100.1/₹103.9 and Gurufocus showed a forward P/E of 21.1x on 2 October 2026.
Method 1: forward P/E scenarios. We start from FY26 revenue from operations of ₹27,958cr. We hold D&A at about ₹1,800cr (the Q4 FY26–Q1 FY27 run-rate, which is higher than in FY26 because of VISUfarma amortisation), interest at about ₹440cr and other income at ₹450–520cr. We assume a 25% tax rate, against 29.8% in Q1 and 22% for FY26. EPS uses 45.7cr shares. These are our simplifying assumptions, not company disclosures. We value on FY28 EPS because it is the first year that is not distorted by exclusivity. The target P/E is set against Lupin's current ~21x forward multiple and the peer range of 23–33x trailing.
| Scenario | FY27 rev. growth | FY28 rev. growth | EBITDA margin FY27 / FY28 | FY28E EPS (₹) | Target P/E | Value/share | vs CMP |
|---|---|---|---|---|---|---|---|
| Bear | 5% | 0% | 23% / 22% | 76.1 | 18.0x | ₹1,370 | −30.0% |
| Base | 8% | 5% | 25% / 24.5% | 98.7 | 21.0x | ₹2,073 | +6.0% |
| Bull | 10% | 10% | 27% / 27% | 121.1 | 24.0x | ₹2,906 | +48.6% |
The bear case uses the bottom of ICRA's 22–25% margin range and assumes FY28 revenue is flat because US growth does not return. The base case takes the midpoint of management's FY27 guidance and assumes only a partial US recovery in FY28. The bull case assumes apixaban and pegfilgrastim launch on time and hold price, with margins at 27%. A 24x multiple is what Axis and PL apply today.
Method 2: discounted cash flow. We use a five-year explicit forecast (FY27–FY31), a WACC of 11.5% and terminal growth of 5%. Base-case revenue growth is 8%, 5%, 8%, 9% and 9%, with EBITDA margins of 24.5–25% and a 25% tax rate. Capex is ₹2,000cr in FY27, excluding VISUfarma, and ₹1,500–1,800cr a year after that, slightly above ICRA's FY28 range of ₹1,000–1,500cr. Incremental working capital is 25% of incremental revenue, about 90 days. Free cash flow rises from about ₹3,550cr to ₹5,510cr. Adding net cash of ₹2,831cr gives an equity value of about ₹70,950cr, or ₹1,552 per share (−20.7%). The terminal value is 76% of EV, so the result depends heavily on the assumptions. The sensitivity grid below shows how much.
| DCF value/share (₹) | g = 4% | g = 5% | g = 6% |
|---|---|---|---|
| WACC 10.5% | 1,603 | 1,829 | 2,156 |
| WACC 11.5% | 1,392 | 1,552 | 1,771 |
| WACC 12.5% | 1,231 | 1,350 | 1,504 |
The DCF only exceeds the current price with both a WACC of 10.5% or below and terminal growth of 6%. The bear and bull DCF cases, using the same paths as the P/E scenarios, give ₹1,134 and ₹1,921.
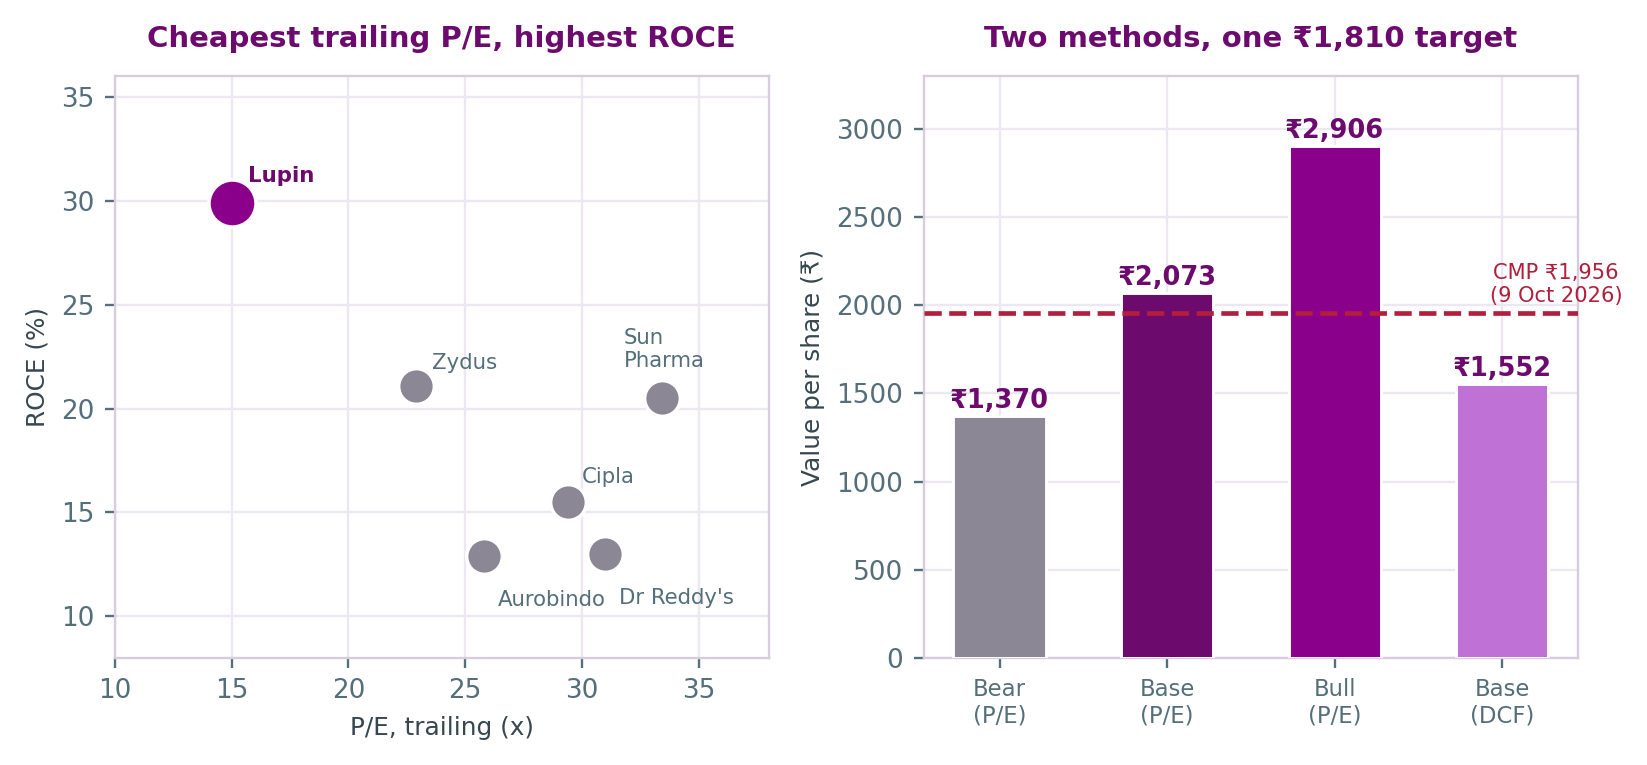
Target. The simple average of the two base cases (₹2,073 and ₹1,552) is ₹1,812, which we round to ₹1,810, 7.5% below the current price. The ₹520 gap between the two methods is mostly the difference between paying 21x for a year of flat earnings and valuing the cash flows those earnings actually produce. We show both instead of choosing the one that gives the more comfortable answer. Under Dart's rating bands, −7.5% is a SELL (−5% or below). It is a narrow SELL: a fall of under 3% in the share price, to about ₹1,905, would make it a HOLD at the same target, and below about ₹1,575 it would be a BUY.
Upgrade triggers: US sales of $280 million or more in Q2 or Q3 FY27, meaning above the top of guidance; final approval of apixaban with a launch date inside FY27; a pegfilgrastim launch that holds price better than the 85–90% erosion analysts have flagged; or a share price at or below about ₹1,905, where our target would imply a HOLD. What would make us more negative: FY27 margin guidance cut below 25%; an OAI or warning letter at Nagpur or Somerset; further antitrust provisions; or a specialty acquisition priced richly enough to bring back net debt.
A SELL can go wrong in both directions. These are the three risks most likely to make it wrong, followed by the variables that move the numbers most.
| Sensitivity factor | Rough effect (Dart arithmetic) |
|---|---|
| EBITDA margin ±100bp (FY28 base) | ±₹317cr EBITDA → ±₹5.2 EPS → ±₹109/share at 21x |
| Target P/E ±1x | ±₹99/share on FY28E EPS of ₹98.7 |
| INR/USD ±₹1 | ±~₹115cr revenue on the $1.15bn US guidance midpoint; FY26 also booked a ₹656cr forex gain inside EBITDA |
| WACC ±100bp (DCF) | −₹202 / +₹277 per share |
| US tariffs (Section 232) | Generics and biosimilars exempt from the 100% tariff on patented drugs; exemption to be reviewed within a year. Not modelled. |
| India price control (NLEM/DPCO) | About 384 drugs covered; additions to the list would hit the 30% of sales from India. Not modelled. |
| Interest rates | Low direct exposure: net cash and interest cover of 20.3x. The effect is through the discount rate, not the P&L. |
| FY23 | FY24 | FY25 | FY26 | Q1 FY27 | |
|---|---|---|---|---|---|
| Revenue from operations | 16,642 | 20,011 | 22,708 | 27,958 | 8,277 |
| EBITDA (ex-forex, ex-other income) | 1,721 | 3,800 | 5,278 | 8,160* | 2,450 |
| EBITDA margin | 10.3% | 19.0% | 23.2% | 29.2% | 29.6% |
| Net profit (PAT) | 448 | 1,936 | 3,306 | 5,355 | 1,417 |
| EPS (₹) | 9.45 | 42.01 | 71.88 | 116.65 | 30.95 |
| Cash from operations | 1,897 | 3,648 | 3,000 | 7,334 | — |
| Free cash flow | 436 | 2,732 | 1,347 | 5,527 | — |
| Borrowings | 4,542 | 2,922 | 5,448 | 6,616 | — |
| US sales (US$ m) | — | — | 944 | 1,318 | 366 |
| *FY26 EBITDA depends on the definition used. The company reports ₹9,240cr (33.6% of sales), including a ₹656cr forex gain and ₹424cr of other income. Axis Direct uses ₹8,816cr (31.5%). ICRA reports an OPM of 30.8% on operating income of ₹28,614.5cr. Screener.in, used here, gives ₹8,160cr (29.2%). Reported FY26 PAT of ₹5,355cr is after ₹558cr of exceptional charges, mainly the US antitrust provision. Axis's adjusted PAT is ₹5,913cr. | |||||
Sources: Lupin press releases (FY26 results, 7 May 2026; Q1 FY27, 6 August 2026); Q1 FY27 earnings-call coverage (alphaspread.com, multibagg.ai); screener.in (prices and peer data, 9 October 2026 close); ICRA rationale, 8 July 2026; Axis Direct result update, 10 August 2026; PL Capital Q4 FY26 update; Business Standard (16 February 2026); Motilal Oswal news (Citi downgrade, 27 August 2026); lupin.com (apixaban tentative approval, 28 September 2026); India Briefing and Crowell & Moring (Section 232). All accessed 11 October 2026.
Dart Consultants is a market intelligence and technology service provider, not a SEBI-registered Investment Adviser or Research Analyst. This report is educational material only. It is not investment advice and not a recommendation to buy or sell any stock. The SELL rating is an educational device for summarising public information and one firm's own valuation, not a regulated recommendation. Several figures here, including the FY27–FY28 earnings scenarios, the DCF and the WACC, are Dart Consultants' own estimates built from public guidance. They were not disclosed by the company or forecast by any brokerage, and they should be read as one firm's reasoning, not as certain. Where sources disagreed, we have shown the disagreement rather than choosing one number without saying so. Readers should verify any figure before relying on it. The analyst(s) preparing this report hold no position in Lupin Ltd, have no banking, advisory or brokerage relationship with the company, and have received no compensation from it.
| 12-month target | ₹1,810 |
| CMP (9 Oct 2026) | ₹1,956 |
| Implied downside | −7.5% |
| Rating | SELL |
| Market cap | ₹89,469 cr |
| P/E (TTM) | 15.0x |
| P/E (FY27E, Dart base) | 20.6x |
| 52-week range | ₹1,900 – ₹2,530 |
| Book value/share | ₹491 |
| Dividend (FY26) | ₹18/share |
| Net cash (Jun 2026) | ₹2,831 cr |
| Shares outstanding | ~45.7 cr |
| Promoter (Gupta family) | 46.85% |
| FII | 22.42% |
| DII (of which MFs ~14.8%) | 24.65% |
| Public | 6.08% |
| FY25 | FY26 | Q1 FY27 | |
|---|---|---|---|
| Revenue | 22,708 | 27,958 | 8,277 |
| EBITDA | 5,278 | 8,160† | 2,450 |
| PAT | 3,306 | 5,355 | 1,417 |
Revenue from operations; EBITDA excludes forex and other income. †Company-reported FY26 EBITDA is ₹9,240cr because it includes a ₹656cr forex gain and ₹424cr of other income. See the financial summary.