Rajesh Power Services is an Ahmedabad-based power transmission and distribution contractor. It traces its history to 1971 and listed on the BSE SME platform in December 2024, after an IPO priced at ₹335. Most of its work is underground cabling, medium-voltage covered conductor (MVCC) conversion and substations for Gujarat's distribution and transmission utilities. It holds a Class "AA" electrical contractor licence in Gujarat and Class "A" in Rajasthan and Madhya Pradesh. It also owns 25.48% of HKRP Innovations, a smart-grid software company. In FY26 it signed its first battery storage project: a 65 MW / 130 MWh asset it will own, with a 12-year tariff contract from GUVNL. The founding Panchal and Patel families hold 72.70%.
Growth has been fast. Revenue rose from ₹207 crore in FY23 to ₹1,628 crore in FY26. FY26 alone was up 52%, with EBITDA of ₹197 crore (a 12.1% margin) and consolidated net profit of ₹143 crore. ROCE is about 44–47% depending on the source. The order book plus L1 bids stood at ₹3,326 crore in March 2026 and ₹3,742 crore in June. CRISIL moved its A- rating to a Positive outlook in July. Management is guiding to about 40% revenue growth in FY27 at an 11–12% EBITDA margin.
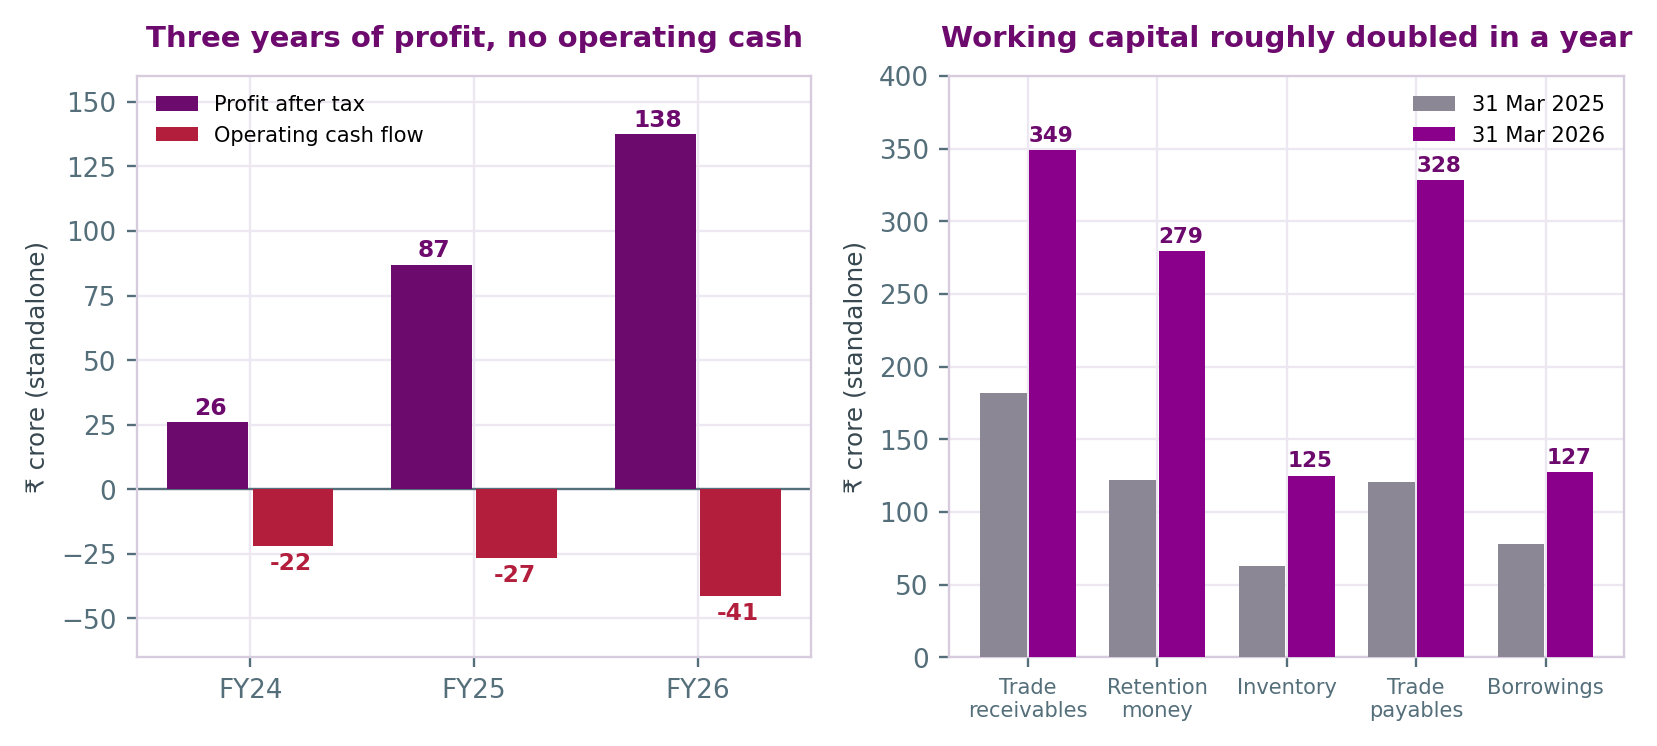
None of that profit has turned into cash. Standalone operating cash flow was −₹22 crore in FY24, −₹26.7 crore in FY25 and −₹41.4 crore in FY26. In FY26, working capital absorbed ₹212 crore, equal to 38% of the year's revenue increase. Receivables plus retention money reached 141 days of revenue. The gap was filled by stretching suppliers, including ₹86.8 crore owed to MSMEs (up from ₹4.9 crore) and ₹86.5 crore under bank supplier-finance arrangements, and by ₹49 crore of extra borrowing. The share price has fallen from a 52-week high of ₹1,605 to ₹733, and at that price the stock trades on 9.6x trailing earnings.
Our rating is BUY, with a target of ₹945 (+28.9%). Even after assuming growth well below guidance, a heavy working-capital drag, a 14% cost of capital and a deep discount to peers, both our methods value the shares above today's price. The discount is still justified to a large degree. Customer and geographic concentration is high, the related-party arrangements are extensive, and the annual report contradicts itself in several places. If working capital keeps absorbing 38% of incremental revenue, as it did in FY26, our DCF falls below the current price. We call this a high-risk BUY.
| Mix (as disclosed) | Figure | Source |
|---|---|---|
| Order book: power distribution (<66 kV, underground cabling, MVCC, RDSS) | ₹2,365cr / 71% | AR / H2 FY26 call, 31 Mar 2026 |
| Order book: power transmission (EHV cable up to 220 kV, GIS/AIS substations up to 400 kV) | ₹961cr / 29% | AR / H2 FY26 call, 31 Mar 2026 |
| Order book from Gujarat / Odisha | 93% / 7% | CRISIL, June 2026 |
| Revenue from the largest two customers, FY26 | 28.9% + 27.2% | AR Note 28 |
| Revenue from the top five clients (Gujarat discoms) | 78% | CRISIL, July 2026 |
| Underground share of the order book | ~70–75% | Management, H2 FY26 call |
| Reportable segments | One (EPC, all domestic) | AR Note 56(K) |
The company reports a single segment and does not split revenue by product, state or customer type. The figures above are the closest available proxies. Note that order-book splits and revenue splits are not the same thing.
How the money is made. Rajesh Power wins state utility tenders, mainly from Gujarat's distribution companies (UGVCL, PGVCL and others) and the state transmission utility (GETCO). It then executes them as turnkey EPC contracts: it buys cables, ring main units, transformers and switchgear, and lays, installs and commissions them with its own crews. Materials made up 82% of FY26 revenue; the gross value added after materials was 18.3%. Two features differ from overhead transmission EPC. Underground work runs on existing road "right of use", which avoids most land-acquisition delays. And projects typically finish in 18–24 months. The trade-off is working capital. Utilities hold back 10–30% of each bill as retention, releasing part on installation and the rest on commissioning against a bank guarantee. Bank guarantees outstanding were ₹312.7 crore at March 2026, 80% of net worth.
Moat: real, but local.
| Metric | Value | Read |
|---|---|---|
| Revenue CAGR, FY23–FY26 | ~99% | ₹207cr → ₹1,628cr; FY26 +52%; guided ~40% for FY27 |
| EBITDA margin | 7% → 12% → 12% → 12% | FY23–FY26; H2 FY26 was 11.4%; guidance 11–12% |
| FCF conversion (FCF / PAT) | Negative, FY24–FY26 | FY26 CFO −₹41.4cr, capex ₹2.2cr, against PAT of ₹137.5cr (standalone) |
| ROCE vs WACC | 44–47% vs ~14%* | AR 43.6% / Note 52 44.6% / screener 47.3%; ROE 35–43% depending on the page |
| Working capital absorbed | 38% of incremental revenue | ₹212cr in FY26 against an increase in revenue of ₹556cr (18% in FY25) |
| Receivables + retention | 141 days | Receivables alone 78 days; CRISIL also reports 141 days |
| Payables | 90 days of materials cost | Includes ₹74cr under supplier finance; MSME dues ₹86.8cr |
| Leverage | D/E 0.33x; interest cover 13.5x | CRISIL counts 75% of ₹43.3cr of promoter loans as quasi-equity |
*WACC of ~14% is a Dart Consultants assumption for an A- rated BSE SME company, not a sourced figure. CRISIL figures are from its 14 July 2026 rationale.
Margins. EBITDA margin has been steady at 11–12% for three years, and CRISIL expects it to stay there. The H2 FY26 dip to 11.4% was put down to billing mix. Operating leverage is real: employee costs fell from 4.1% to 3.6% of revenue. But other expenses rose 47%, including bank guarantee commission up 3x to ₹4.0 crore, legal and professional fees, and site costs. Nothing in the disclosures suggests margins can expand much from here, and management only commits to "a stabilized margin".
Cash and returns. The high ROCE and the negative cash flow describe the same business. Capital employed is small relative to revenue because suppliers and promoters fund much of the working capital, which makes ROCE look high. But each step up in revenue ties up more receivables and retention. Management told analysts the March 2026 receivables spike reflected "very high billing in the month of March". It said payment terms are 45–60 days and that ₹150 crore of the ₹348.8 crore had been collected by 23 April. If correct, the H1 FY27 balance sheet should show it.
Near-term catalysts (6–12 months)
Longer-term catalysts (2–3 years)
As an SME-listed company, Rajesh Power is exempt from SEBI LODR Regulations 17–27. That covers board composition, the related-party approval regime and the corporate governance report, and the Board's Report says so. It reports half-yearly rather than quarterly. It did nonetheless put a Regulation 23-style omnibus related-party resolution to the September 2026 AGM, which is better than the minimum. This is the first set of accounts under Ind AS, and the auditor, Dinesh R. Thakkar & Co., includes a routine emphasis of matter on the transition. The audit opinion is unmodified, and revenue recognition on the input method is a key audit matter.
The rating trajectory has been positive: CRISIL went from BBB+/Positive to A-/Stable in August 2025, then to A-/Positive in July 2026. Bank-limit utilisation averaged 34% over the year to May 2026. The secretarial audit has no observations. Board attendance was complete, and the three independent directors include a former IAS officer and a chartered accountant. The company pays a dividend (₹1 a share for FY26) and spent its full CSR obligation (₹1.12 crore). Promoter holding is high at 72.70%. CRISIL counts ₹43.3 crore of promoter loans as subordinated and treats 75% of them as equity.
All four executive directors are promoters, and a promoter whole-time director sits on the audit committee.
Three.
The AGM voting results on the HKRP limit and the Section 185 powers (we have not seen them); actual FY27 purchases from HKRP against the ₹500 crore limit; who the "others" covered by the ₹28.4 crore guarantees are; whether MSME dues are brought within 45 days; and whether a corrected AOC-2 is filed.
Below adequate. We found no audit qualification, no regulatory action and no default. The rating trend is positive. But in a company of this size, the related-party arrangements are unusually broad: purchases from a partly promoter-owned associate, guarantees for sister concerns, two-way family loans and family salaries. The SME listing removes the formal checks a mainboard listing would impose, and the annual report contains enough internal contradictions to reduce confidence in it. This is the main reason we apply a large discount to peer multiples.
Multiples against peers. Prices are 9 October 2026 closes from screener.in. None of the peers is a clean match: they are larger, mainboard-listed and more diversified, and only Transrail is close in business mix. There is no broker coverage of Rajesh Power. Its trading history is under two years and covers a 50% fall in the share price, so we do not use a historical multiple.
| Company | Mcap (₹cr) | P/E TTM | P/S (FY26) | FY26 OPM | ROCE | 3-yr sales CAGR |
|---|---|---|---|---|---|---|
| Rajesh Power Services | 1,320 | 9.6x | 0.81x | 12% | 47.3% | 99% |
| Transrail Lighting | 6,238 | 14.9x | 0.91x | 14% | 33.6% | 30% |
| KEC International | 9,845 | 16.4x | 0.42x | 8% | 16.5% | 11% |
| Kalpataru Projects | 23,770 | 21.4x | 0.88x | 9% | 18.3% | 18% |
| Techno Electric | 11,105 | 25.8x | 3.41x | 14% | 14.9% | 58% |
| Rajesh Power at ₹733 | Trailing (FY26) | FY27E (Dart base) |
|---|---|---|
| P/E | 9.6x standalone / 9.2x consolidated | 7.4x (EPS ₹98.6) |
| EV/EBITDA (EV ~₹1,446cr) | 7.3x (₹197cr) | 5.9x (₹243cr) |
| P/S | 0.81x | 0.62x (₹2,116cr) |
| P/B | 3.4x | — |
Method 1: forward P/E scenarios (FY27E). We start from FY26 revenue of ₹1,628 crore, add about ₹6 crore of HKRP associate profit, take interest at about ₹15 crore (higher borrowing) and other income at ₹5 crore, and apply a 26% tax rate. EPS uses 1.80 crore shares. These are our assumptions. We set the target multiple well below every peer to reflect the cash conversion, concentration and governance issues described above.
| Scenario | FY27 rev. growth | EBITDA margin | PAT (consol.) | EPS (₹) | Target P/E | Value/share | vs CMP |
|---|---|---|---|---|---|---|---|
| Bear | 12% | 10.5% | ₹139cr | 77.3 | 7.0x | ₹541 | −26.2% |
| Base | 30% | 11.5% | ₹178cr | 98.6 | 10.0x | ₹986 | +34.5% |
| Bull | 40% (guidance) | 12.0% | ₹200cr | 111.0 | 13.0x | ₹1,443 | +96.9% |
The bear case assumes growth close to Q1 FY27's annualised run-rate (₹437cr × 4 ≈ ₹1,750cr) plus a little more, with margin slipping below the guided range, and a multiple that treats earnings as low-quality. The base case is a third below guided growth, at the middle of the margin range. A 10x multiple is a third below Transrail and less than half of Kalpataru and Techno. The bull case takes guidance at face value and gives a multiple still below every peer.
Method 2: discounted cash flow, with working capital made explicit. We use a five-year forecast (FY27–FY31) with revenue growth of 30%, 25%, 20%, 15% and 12%, an 11.5% EBITDA margin, a 26% tax rate and ₹8 crore of annual capex. We deduct ₹30 crore of BESS equity in FY27. Working capital absorbs 30% of each year's increase in revenue: worse than CRISIL's 83-day net cycle implies, but better than FY26's 38%. Discounting at a 14% WACC with 6% terminal growth and deducting ₹126 crore of net debt gives ₹904 per share (+23.3%). Free cash flow is slightly negative in FY27 (−₹4 crore) and turns positive from FY28. The terminal value is 82% of enterprise value.
| DCF value/share (₹) | g = 5% | g = 6% | g = 7% |
|---|---|---|---|
| WACC 13% | 938 | 1,065 | 1,235 |
| WACC 14% | 809 | 904 | 1,027 |
| WACC 15% | 705 | 779 | 871 |
| Working capital as % of incremental revenue | 20% | 30% (base) | 38% (FY26 actual) |
|---|---|---|---|
| DCF value/share (₹) at 14% / 6% | 1,167 | 904 | 695 |
Working capital is the variable that matters most. At FY26's actual intensity the DCF falls 5% below today's price. The bear and bull DCF cases give ₹554 and ₹1,410.
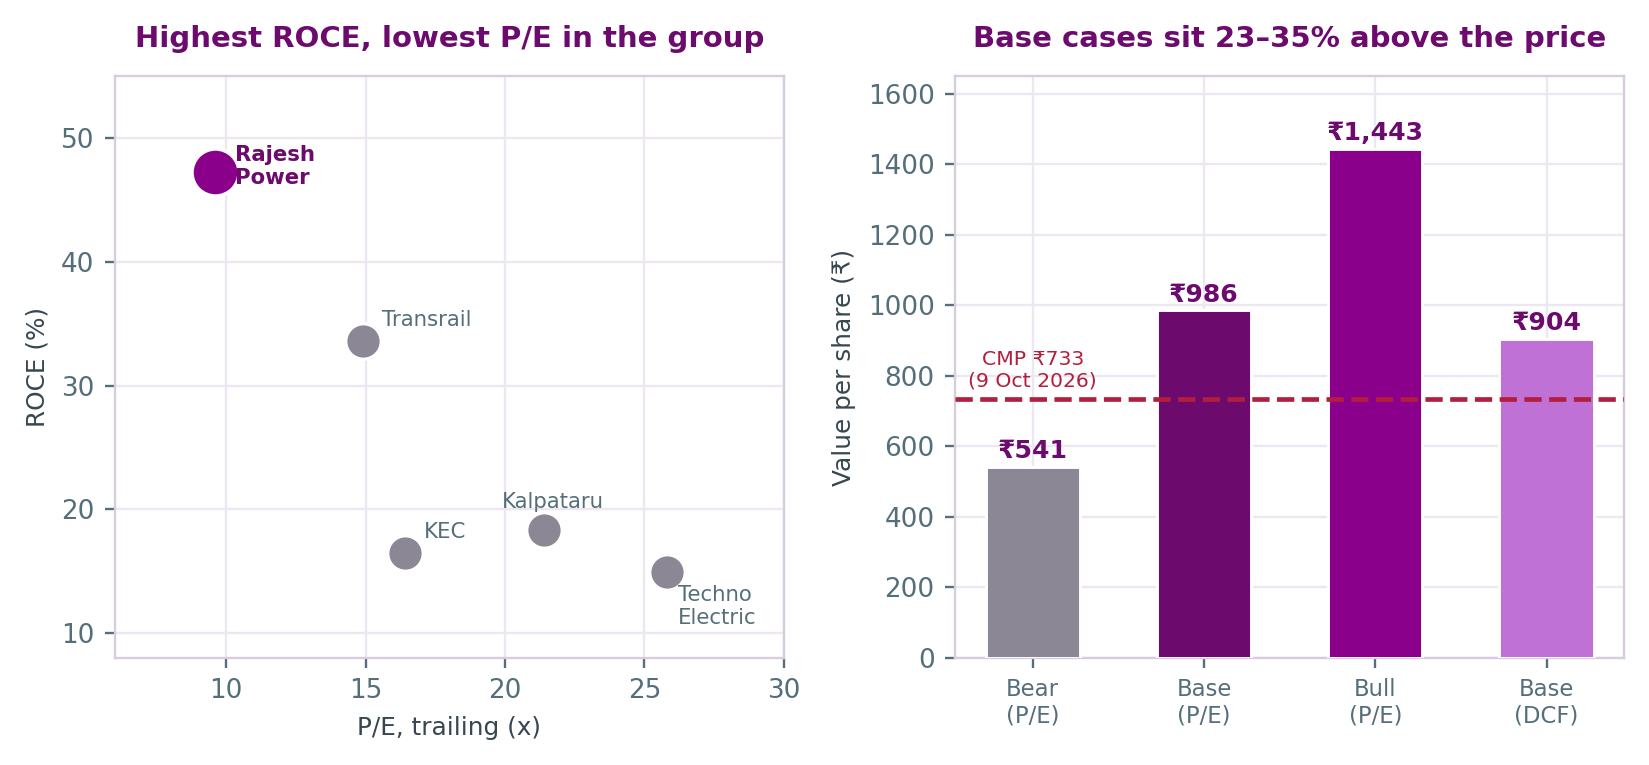
Target. The average of the two base cases (₹986 and ₹904) is ₹945, 28.9% above the current price. That is a BUY under Dart's rating bands (+15% or more). We call it a high-risk BUY because the two scenarios that would make it wrong are plausible. One is working capital staying at FY26 intensity; the other is the related-party limits being used at scale. Both would show up in the H1 FY27 accounts.
What would strengthen the call: positive operating cash flow in H1 FY27; receivable days back toward the ~60 days management indicated; MSME dues brought within 45 days; purchases from HKRP staying near FY26 levels rather than approaching the ₹500 crore limit; new orders outside Gujarat. What would make us downgrade: another half-year of negative operating cash flow; a sharp rise in purchases from HKRP or in guarantees for sister concerns; any loan made under the Section 185 powers to a promoter-linked entity; EBITDA margin below 11%; a fall in the order book.
| Sensitivity factor | Rough effect (Dart arithmetic) |
|---|---|
| Working capital ±10pp of incremental revenue | DCF ₹1,167 (at 20%) / ₹695 (at 38%) against ₹904 base |
| EBITDA margin ±100bp (FY27E revenue ₹2,116cr) | ±₹21cr EBITDA → ±₹8.7 EPS → ±₹87/share at 10x |
| FY27 revenue growth ±10pp | ±₹163cr revenue → ±₹7.7 EPS → ±₹77/share at 10x |
| Target P/E ±2x | ±₹197/share on base EPS of ₹98.6 |
| Commodity prices (copper, aluminium, cable) | Passed through on "most items" via escalation clauses, per management; not modelled |
| Interest rates | ₹127cr of borrowings: +100bp ≈ ₹1.3cr a year before tax; BG commission (₹4.0cr) also rises with guarantee volume |
| BESS project cost | Management range ₹1.5–2.5cr/MW (₹98–163cr for 65 MW), 70–80% debt; FY27 equity assumed at ₹30cr |
| FY23 | FY24 | FY25 | FY26 | |
|---|---|---|---|---|
| Revenue from operations | 207 | 285 | 1,072.1 | 1,627.9 |
| EBITDA (excl. other income) | 14 | 34 | 123.9 | 197.2 |
| EBITDA margin | 6.8% | 11.9% | 11.6% | 12.1% |
| Net profit (standalone) | 7 | 26 | 86.9 | 137.5 |
| Net profit (consolidated) | — | — | 96.6 | 143.2 |
| EPS, standalone (₹) | 4.44 | 17.10 | 53.72 | 76.38 |
| Cash from operations (standalone) | 15 | −22 | −26.7 | −41.4 |
| Borrowings | 60 | 78 | 77.9 | 127.2 |
| Net worth (standalone) | ~58 | 83.6 | 255.1 | 390.7 |
| Order book incl. L1 (year-end) | — | — | — | 3,326 |
| FY25–FY26: FY26 annual report (Ind AS; FY25 restated). FY23–FY24: screener.in (standalone, previous GAAP), plus the annual report's KPI page for EBITDA and margin, and the Ind AS opening balance sheet for FY24 net worth. Screener gives FY25 EPS as ₹48.25 using a different share count; the annual report's ₹53.72 uses weighted average shares after the IPO. Contingent liabilities at March 2026 were ₹411.9 crore: ₹312.7 crore of bank guarantees and ₹99.2 crore of co-guarantees. | ||||
Sources: Rajesh Power Services Annual Report 2025-26 (user-supplied, 269 pages: corporate overview, MD&A, AGM notice and related-party annexures, Board's Report and annexures, standalone and consolidated financial statements with notes 1–57, auditor's reports and CARO); H2 FY26 earnings call transcript (23 April 2026, rajeshpower.com); CRISIL Ratings rationale (14 July 2026); Q1 FY27 business update coverage (businessupturn.com, sahi.com); screener.in (prices, history and peers, 9 October 2026 close). All accessed 11 October 2026.
Dart Consultants is a market intelligence and technology service provider, not a SEBI-registered Investment Adviser or Research Analyst. This report is educational material only. It is not investment advice and not a recommendation to buy or sell any stock. The BUY rating is an educational device for summarising public information and one firm's own valuation, not a regulated recommendation. The FY27 scenarios, the DCF, the WACC and the working-capital assumptions are Dart Consultants' own estimates, not company or brokerage forecasts. Company guidance is quoted as stated on the earnings call. SME-listed stocks can be illiquid and volatile, and are subject to lighter disclosure requirements than mainboard companies. Readers should verify any figure before relying on it. The analyst(s) preparing this report hold no position in Rajesh Power Services Ltd, have no relationship with the company, and have received no compensation from it.
| 12-month target | ₹945 |
| CMP (9 Oct 2026) | ₹733 |
| Implied upside | +28.9% |
| Rating | BUY (high risk) |
| Market cap | ₹1,320 cr |
| P/E (TTM, standalone) | 9.6x |
| P/E (FY27E, Dart base) | 7.4x |
| 52-week range | ₹705 – ₹1,605 |
| Book value/share | ₹217 (standalone) |
| Dividend (FY26) | ₹1/share |
| Net debt (Mar 2026) | ~₹126 cr* |
| Shares outstanding | 1.80 cr (FV ₹10) |
| Listing | BSE SME |
| Promoter group | 72.70% |
| FII | 0.68% |
| DII | 3.52% |
| Public (6,172 holders) | 23.11% |
| FY25 | FY26 | Q1 FY27 | |
|---|---|---|---|
| Revenue | 1,072 | 1,628 | 437 |
| EBITDA | 124 | 197 | n/d |
| PAT (consol.) | 96.6 | 143.2 | n/d |
| CFO (standalone) | −26.7 | −41.4 | n/d |
*Borrowings of ₹127.2cr less free cash of ₹1.3cr. A further ₹80cr of fixed deposits is held as margin money against bank guarantees and is not counted as free cash. Q1 FY27 is a revenue-only business update; the company reports results half-yearly. n/d = not disclosed.