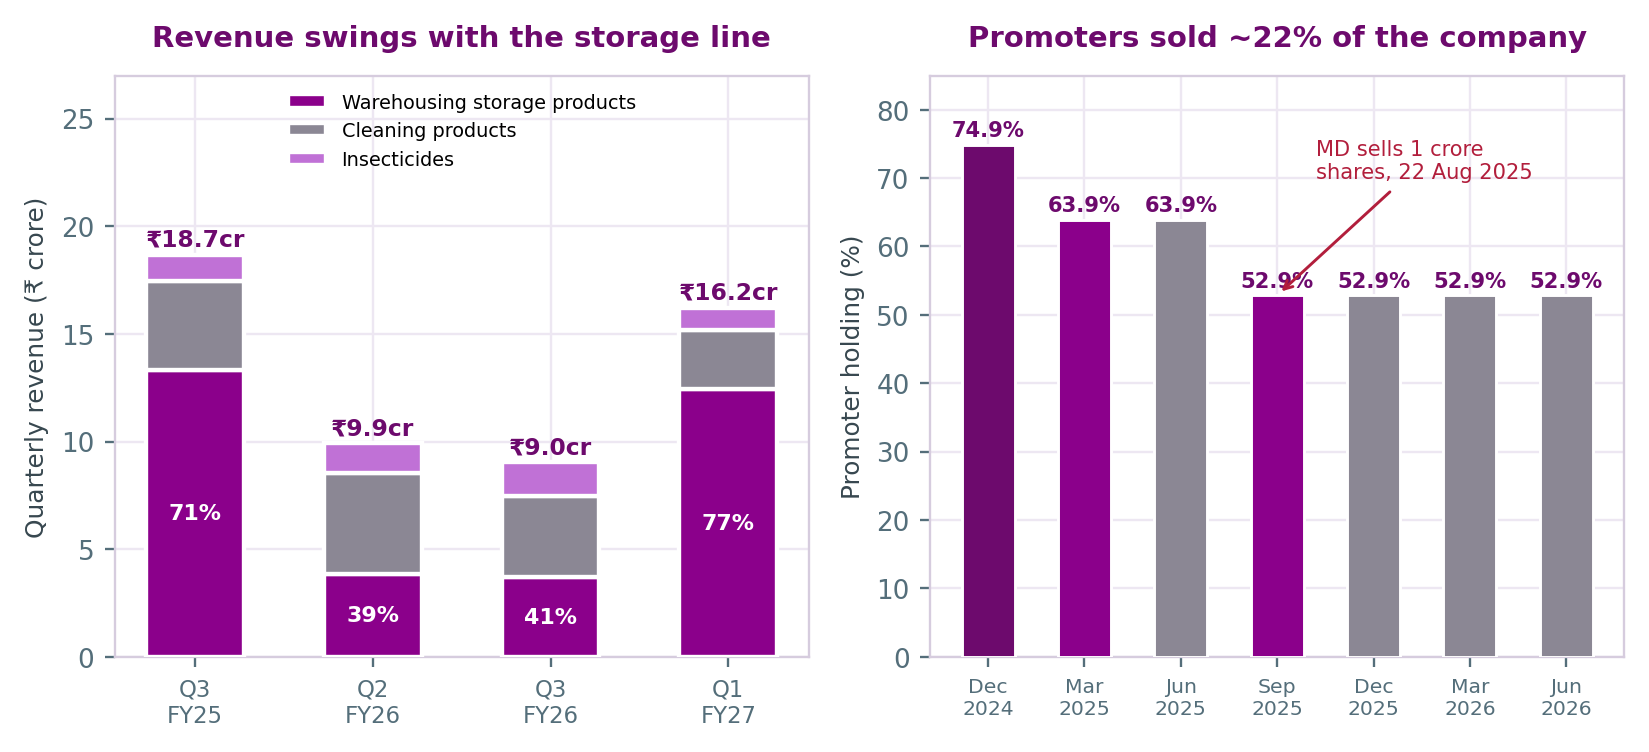
Yuvraaj Hygiene Products is a Navi Mumbai company, listed only on the BSE. It sells cleaning products under the HIC name (the company's website is hic.in): scrub pads, floor and toilet cleaners, and surface disinfectants. It also sells insecticides, mainly mosquito repellents and sprays. In FY25 it added a third line, which it calls "warehousing storage products" (storage racks, containers and dividers). The FY26 annual report says the company manufactures these items. The MD's profile filed with the BSE in February 2026 describes the same move as "diversification into the wholesale of plastic-related products". In Q1 FY27 that line was 77% of revenue. The founding couple, Vishal Kampani (Managing Director) and Benu Kampani (Whole-time Director), hold 52.86% between them. The company had 40 permanent employees at March 2026, down from 60 a year earlier.
The financial record is short and uneven. The company lost money in every year from FY15 to FY24. Revenue then jumped to ₹46.3 crore in FY25 with a ₹5.87 crore profit. The new storage line produced 90% of that year's segment profit. In FY26 revenue fell 16% to ₹38.7 crore and profit fell 44% to ₹3.31 crore, because storage-products revenue dropped from ₹25.8 crore to ₹16.5 crore. Q1 FY27 brought another surge, to ₹16.2 crore of revenue and ₹1.93 crore of profit, with ₹12.4 crore of the revenue from the storage line. Operating cash flow went from +₹5.67 crore in FY25 to −₹3.09 crore in FY26. The gap was filled by the MD: interest-free loans from him stood at ₹11.0 crore at March 2026, up from ₹1.46 crore, and no loan agreement was executed for them.
The share price has been even more volatile. It reached ₹20.41 on 25 August 2025, three days after the MD sold 1 crore shares (11% of the company) on the open market. It then fell 82% to ₹3.75 by 1 April 2026, and has since recovered to ₹9.23. At that price the market value is ₹83.7 crore, or 18.5x trailing earnings, close to Jyothy Labs' 18.9x. Jyothy owns Ujala and Maxo and earns ₹370 crore a year.
Our rating is SELL. The consumer business, cleaning and insecticides, is small and competitive. It earned ₹1.55 crore of segment profit on ₹22.3 crore of revenue in FY26, about 7%. The profit that matters comes from the storage line, whose customers, contracts and repeatability are not disclosed. One customer we can identify is a related party: ₹6.13 crore of FY26 sales, 16% of revenue, went to Midas Hygiene Industries Pvt Ltd, an entity the annual report lists as controlled or significantly influenced by key management or their family. The auditor drew attention to a material going-concern uncertainty in the FY25 audit, the Q3 FY26 review and the FY26 audit. A fair multiple for this profile is well below what a branded FMCG company commands. Our base case is ₹6.70.
| Segment (₹ crore) | FY25 | FY26 | YoY | % of FY26 | Q1 FY27 | % of Q1 |
|---|---|---|---|---|---|---|
| Warehousing storage products | 25.77 | 16.46 | −36% | 42% | 12.44 | 77% |
| Cleaning products (HIC brand) | 16.77 | 17.15 | +2% | 44% | 2.73 | 17% |
| Insecticide products | 3.72 | 5.13 | +38% | 13% | 1.05 | 6% |
| Total | 46.27 | 38.74 | −16% | 100% | 16.21 | 100% |
Source: FY26 annual report, Note 42 (audited); Q1 FY27 results, 13 August 2026, via multibagg.ai. All revenue is domestic. Assets and liabilities are not allocated to segments. FY26 segment profit before interest, tax and depreciation: storage ₹4.09cr, cleaning ₹1.21cr, insecticides ₹0.35cr (FY25: ₹6.17cr / ₹0.56cr / ₹0.15cr).
How the money is made. There are two different businesses here. The first is the consumer one: small-ticket cleaning products and insecticides (the latter added in FY25) sold through distributors, institutional buyers and online channels. Combined, it produced ₹22.3 crore of revenue in FY26, a little above the whole company's ₹18–19 crore in FY22–FY24, when it was losing money. The second is the storage-products line, which management launched in FY25 to sell storage racks, containers, dividers and accessories to "industrial and logistics sector clients". The shareholders approved a change to the company's objects clause in June 2025 to cover products made from plastics, steel and wood, including furniture. It is lumpy: ₹13.3 crore in Q3 FY25, ₹3.7–3.9 crore a quarter in Q2–Q3 FY26, then ₹12.4 crore in Q1 FY27. On the company's own segment figures, it is where most of the profit comes from. In Q3 FY26, cleaning products made a segment loss of ₹0.16 crore while warehousing products earned ₹1.00 crore.
Made or traded? The company describes this line in two ways. The FY26 accounts say it "manufactures… storage containers and dividers". The P&L has no purchases of stock-in-trade line, and material consumption is shown as "materials procured for production of finished goods" (₹18.9 crore). The MD's February 2026 profile, however, calls it "wholesale of plastic-related products". Plant and machinery has a net book value of only ₹2.4 crore, and the company owns no immovable property. Our reading is that it is at most a light-assembly operation, but the disclosures do not settle this.
One caveat applies to all segment margins. Note 2 to the quarterly results says material costs are allocated to segments "based on the annual ratio of material consumed by each segment". Quarterly segment profit is therefore partly an accounting allocation rather than a measured figure.
Moat: we could not find one.
| Metric | Value | Read |
|---|---|---|
| Revenue CAGR, FY23–FY26 | 26% | Almost all from the storage line added in FY25; cleaning is roughly flat |
| EBITDA margin | −4.3% → 2.9% → 14.9% → 14.6% | FY23 to FY26; 16.1% in Q1 FY27 |
| FCF conversion (FCF / PAT) | 45% FY25; negative FY26 | FY26 FCF of −₹5.49cr against PAT of ₹3.31cr |
| ROCE vs cost of capital | 29.8% vs ~15%* | High because the capital base is tiny (net worth ~₹4.5cr), not because the business is strong |
| Cash conversion cycle | 21 → 133 days | FY25 to FY26; receivables 19 → 71 days, inventory 64 → 176 days |
| Tax rate | 0% FY25; 7.5% FY26; ~12% Q1 FY27 | Brought-forward losses are being used up; a normal rate is coming |
| Borrowings / net worth | ₹11.6cr / ₹4.5cr | Company's own debt/equity is 2.73x; ₹11.0cr is an interest-free loan from the MD |
*Cost of capital of ~15% is a Dart Consultants assumption for an unrated BSE micro-cap, not a sourced figure. All other figures are from screener.in and company filings.
Margins and earnings quality. The jump from losses to a ~15% EBITDA margin came with the storage line, not from improvement in the old business. Discounts also rose sharply in FY26, from ₹1.18 crore (2.5% of gross sales) to ₹3.70 crore (8.7%). Depreciation doubled from ₹0.96 crore to ₹1.91 crore. Of the ₹2.40 crore spent on fixed assets in FY26, ₹1.33 crore went on motor vehicles. Interest is very low (₹0.16 crore) because the MD's ₹11.0 crore loan is interest-free. The finance cost is a car loan and leases. Profit would be lower if the company had to borrow at market rates. The tax line will also normalise. The company paid no tax in FY25 because of accumulated losses, and its effective rate is now rising, which will cut net profit even if operating profit holds.
Cash. FY25 looked healthy: operating cash flow of ₹5.67 crore was close to profit. FY26 reversed it. Revenue fell, but receivables and inventory both rose sharply, operating cash flow went negative, and financing brought in ₹4.7 crore net. Most of the inventory build was raw materials (₹8.74 crore, up from ₹3.61 crore). In fairness, the receivables are recent: 97% were under six months old at March 2026. That fits the company stocking up for the larger Q1 FY27 orders rather than carrying bad debt. The FY27 cash-flow statement will show whether it converts.
Near-term catalysts (6–12 months)
Longer-term catalysts (2–3 years)
Yuvraaj is listed on the BSE mainboard, but for FY26 it was exempt from SEBI LODR Regulations 17–27 (board composition, committees, related-party approval and half-yearly related-party reporting). The exemption applies because its paid-up capital and net worth are below SEBI's thresholds. So the more detailed disclosure that would help an outside investor, especially on related-party transactions with promoters who also lend to the company, is not required. The company keeps an audit committee, a nomination and remuneration committee and a stakeholders' relationship committee anyway. The independent chair heads the audit committee, but the MD is one of its three members.
No promoter shares are pledged. The promoters have lent money to the company interest-free when it needed it, and they have given the auditor a letter undertaking to cover any liquidity shortfall for 12 months from the balance-sheet date. There are no contingent liabilities. All five directors attended all eight board meetings in FY26. The FY26 secretarial audit carries no qualification, and the company spent its ₹3.2 lakh CSR obligation. Independent directors were refreshed in April 2024.
The board has five members, three of them from the Kampani family: Vishal Kampani (MD), Benu Kampani (WTD) and Ankur Kampani (non-executive), who is the MD's brother and sits on the nomination and remuneration committee that recommends the MD's pay. The independent directors were paid no sitting fees in FY26. The chair, Vishal Chamanlal Gupta, is independent. The postal ballot re-appointing the two executive directors passed with 99.46% in favour. However, only 0.72% of public non-institutional shareholders voted, so in practice the promoters approved their own re-appointment and pay. The secretarial audit for FY25 found two lapses: the website did not comply with Regulation 46 (attributed to malware and a change of vendor), and the AGM proceedings were filed late. The MD's loan of ₹11.0 crore has no executed agreement, repayment terms or interest, according to Note 15. Rajasthan Global Securities Pvt Ltd held 10.03% at March 2025 but was below the 5% disclosure line a year later. We could not identify what links it to the company, if anything.
Two, both disclosed. First, the statutory auditor (N.S. Gokhale & Co., Thane) has reported a "Material Uncertainty Related to Going Concern" in the FY25 audit, the Q3 FY26 limited review and the FY26 audit. Its stated reasons are the history of accumulated losses and the need to establish consistent profitability, and it notes the company's reliance on the promoters' commitment to support temporary cash needs. Second, the promoters reduced their holding from 74.90% to 52.86% between January and August 2025. This included the MD's open-market sale of 1 crore shares on 22 August 2025, three days before the stock's ₹20.41 peak and shortly before an 82% fall. No reason was given in the filing. A promoter selling is not wrongdoing in itself, and the sale was disclosed. But it is the most direct signal available of how the people running the business valued the shares at that time. In the same financial year, the MD's loans to the company rose from ₹1.46 crore to ₹11.0 crore. The company is now funded mainly by the MD's credit, not his equity.
Whether the going-concern paragraph is repeated in the H1 FY27 review; any further promoter sales; whether the MD's loan is formalised or repaid; the size of sales to Midas Hygiene Industries; disclosure of who the other storage-line customers are; and whether the ESIC shortfall is provided for.
Weak. We found no regulatory action, pledge, contingent liability or accounting restatement, and the promoters keep funding the company. Against that:
Multiples. There is no broker coverage, no management guidance and no directly comparable listed company. We use Jyothy Labs as the reference point for the consumer businesses because it overlaps in insecticides and household cleaning. It is a far larger and better-established company, which is the point of the comparison. We could not find Yuvraaj's own historical average multiple; for most of the last ten years it had no earnings, so a P/E history would mean little.
| At ₹9.23 / 9 Oct 2026 | Yuvraaj Hygiene | Jyothy Labs |
|---|---|---|
| Market cap | ₹83.7cr | ₹6,902cr |
| P/E (TTM) | 18.5x | 18.9x |
| EV/EBITDA (TTM) | ~13.3x* | not computed |
| P/S (TTM) | 1.8x | 2.4x (FY26) |
| ROCE | 29.8% | 24.6% |
| OPM (FY26) | 14.6% | 18% |
| 3-yr sales CAGR | 26% | 9% |
| Years of continuous profit | 2 | Long record |
| Auditor going-concern note | Yes | No |
*EV = market cap plus net debt of ₹10.9cr (borrowings ₹11.63cr less cash ₹0.77cr, 31 March 2026, excluding lease liabilities). Jyothy figures are from screener.in, 9 October 2026 close.
Method 1: forward P/E scenarios (FY27E). Depreciation is held at about ₹2.3 crore (the Q4 FY26 run-rate) and interest at about ₹0.25 crore. The tax rate rises to 18–20% as loss carry-forwards run out. EPS uses 9.07 crore shares. These are our assumptions, not company guidance (there is none).
| Scenario | FY27 revenue | EBITDA margin | PAT | EPS (₹) | Target P/E | Value/share | vs CMP |
|---|---|---|---|---|---|---|---|
| Bear | ₹39cr (FY26 level) | 13% | ₹2.0cr | 0.22 | 12x | ₹2.67 | −71% |
| Base | ₹49cr | 15% | ₹3.9cr | 0.43 | 15x | ₹6.51 | −29% |
| Bull | ₹65cr (Q1 × 4) | 16% | ₹6.3cr | 0.69 | 18x | ₹12.47 | +35% |
Base revenue is Q1 FY27 (₹16.2cr) plus three quarters at ~₹11cr, slightly above the Q2–Q4 FY26 average of ₹10.4cr. The bull case assumes Q1 is the new normal. The bear case assumes FY27 matches FY26. A 15x base multiple is a ~20% discount to Jyothy Labs, reflecting the going-concern note, the reliance on a lumpy B2B line, the related-party sales, negative FY26 cash flow and the absence of any institutional holders. The bull case's 18x is roughly Jyothy's multiple.
Method 2: EV/EBITDA cross-check. Applying 10x to base-case FY27 EBITDA of ₹7.35 crore gives an enterprise value of ₹73.5 crore. That is below today's ~13.3x trailing, because we think trailing EBITDA includes a peak quarter. Subtracting net debt of ₹10.9 crore (borrowings less cash at March 2026) gives equity of ₹62.6 crore, or ₹6.91 per share. We treat the MD's interest-free loan as debt: it has no repayment terms, but it is still a claim ahead of shareholders.
Why there is no full DCF. With a two-year profit record, negative FY26 free cash flow, no guidance and one segment whose revenue swings threefold between quarters, any five-year cash-flow forecast would rest almost entirely on our own guesses. It would also look more precise than it is. Instead we asked what the current price implies. At ₹9.23 the market value is ₹83.7 crore. At 15x that requires ₹5.6 crore of sustainable profit, and at Jyothy's 18.9x it requires ₹4.4 crore, which is about where trailing profit already is, including the strongest quarter in the company's history. In other words, the price assumes Q1 FY27 was not unusual and applies a large-cap consumer multiple to it.
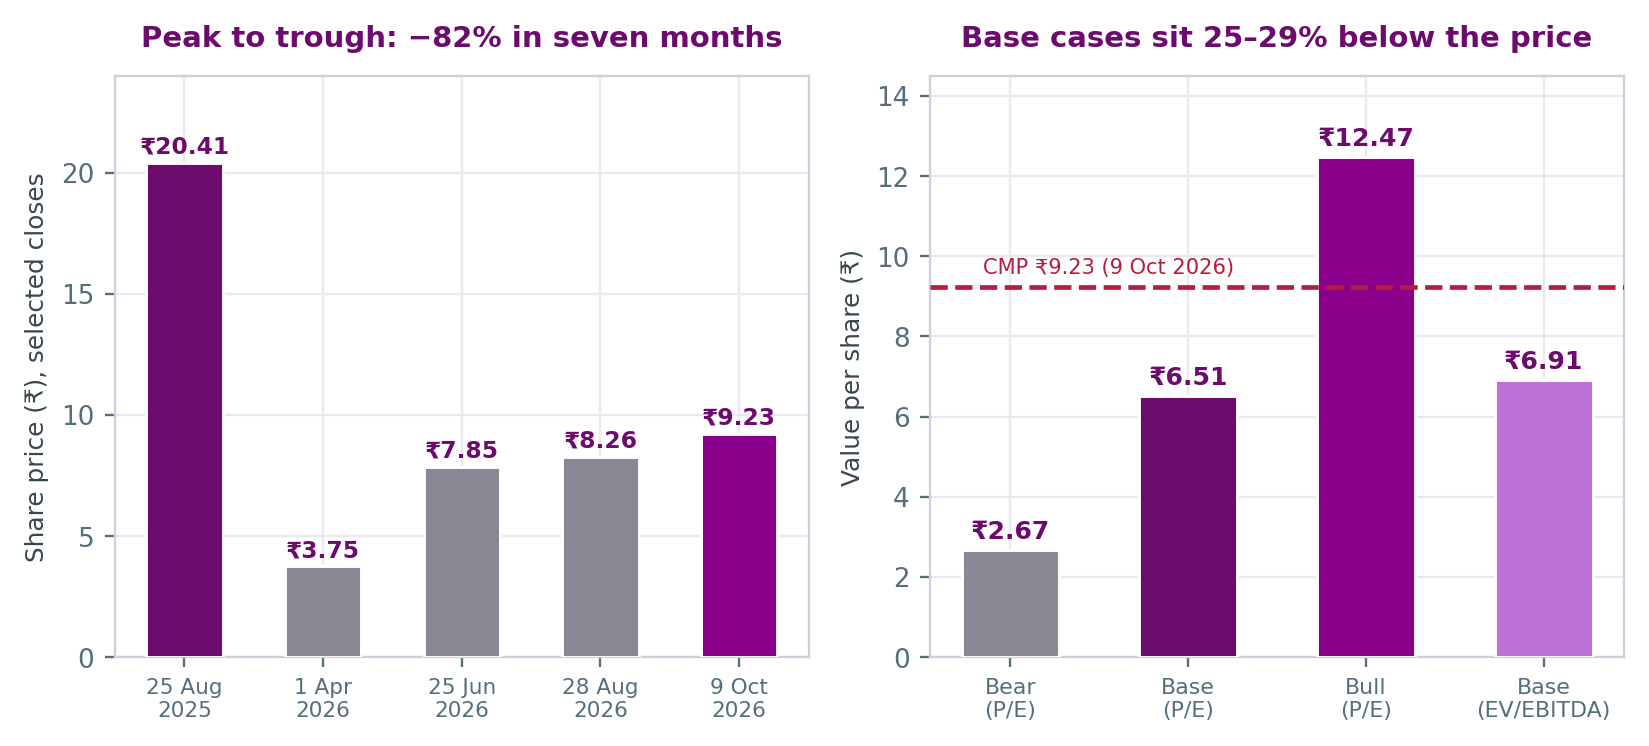
Target. The average of the two base cases (₹6.51 and ₹6.91) is ₹6.71, which we round to ₹6.70, 27.4% below the current price. This is ₹0.10 higher than our first version of this report, because the annual report gave exact cash and borrowing figures. Under Dart's rating bands this is a clear SELL. The bull case of ₹12.47 is plausible if Q1 repeats, so the call depends heavily on the Q2 FY27 result. In a stock this small and thinly held, the price can also move a long way regardless of fundamentals.
Upgrade triggers: two more quarters of revenue at or above ₹15 crore with positive operating cash flow; disclosure of the storage segment's customers and a falling share of related-party sales; the MD's loan formalised or converted to equity; removal of the going-concern paragraph. What would make us more negative: warehousing revenue falling back to the ₹4 crore level; further promoter sales; borrowings rising again without a matching rise in revenue; any qualification beyond the current going-concern note.
| Sensitivity factor | Rough effect (Dart arithmetic) |
|---|---|
| FY27 revenue ±₹10cr (at 15% OPM) | ±₹1.5cr EBITDA → ±₹0.13 EPS → ±₹2.0/share at 15x |
| EBITDA margin ±100bp (base revenue) | ±₹0.49cr EBITDA → ±₹0.04 EPS → ±₹0.66/share at 15x |
| Target P/E ±3x | ±₹1.30/share on base EPS of ₹0.43 |
| Tax rate 18% → 25% | −₹0.34cr PAT → about −₹0.55/share at 15x |
| INR / input costs | Raw-material imports ₹3.99cr in FY26 with no export earnings; year-end FX exposure is small (₹0.91L of import payables). Not modelled. |
| Interest rates | ₹11.0cr MD loan is interest-free; if replaced with market-rate debt at 9–10%, about ₹1.0–1.1cr a year of extra interest (illustrative), roughly a quarter of base-case PBT |
| FY22 | FY23 | FY24 | FY25 | FY26 | Q1 FY27 | |
|---|---|---|---|---|---|---|
| Revenue from operations | 18.36 | 19.38 | 18.98 | 46.26 | 38.74 | 16.21 |
| EBITDA | −1.05 | −0.84 | 0.55 | 6.90 | 5.65 | 2.61 |
| EBITDA margin | −5.7% | −4.3% | 2.9% | 14.9% | 14.6% | 16.1% |
| Net profit | −1.43 | −1.18 | −0.34 | 5.87 | 3.31 | 1.93 |
| EPS (₹) | −0.16 | −0.13 | −0.04 | 0.65 | 0.37 | 0.21 |
| Cash from operations | 0.23 | 0.36 | 0.21 | 5.67 | −3.09 | — |
| Free cash flow | 0.04 | 0.27 | −0.25 | 2.63 | −5.49 | — |
| Borrowings (incl. leases) | 7.37 | 7.04 | 7.63 | 7.36 | 12.20 | — |
| Net worth (equity + reserves) | −3.24 | −4.41 | −4.75 | 1.24 | 4.48 | — |
| Source: screener.in (standalone; the company has no subsidiaries). The company's own figures in lakh match screener to rounding: FY26 revenue ₹3,873.84L and PAT ₹331.35L; FY25 revenue ₹4,626.50L and PAT ₹586.62L. Screener's equity capital of ₹9.32cr includes ₹25 lakh of forfeited shares. Paid-up capital is ₹906.56 lakh, or 9.07cr shares of ₹1 (annual report Note 13), and we use 9.07cr shares for per-share figures. Net worth turned positive in FY25 (₹1.24cr) and was ₹4.48cr at March 2026. Screener's FY26 borrowings include ₹0.57cr of lease liabilities. The company's own debt/equity ratio is 2.73x (Note 41). Other sources quote different debt/equity figures (scanx 3.42x, MarketsMojo 4.65x), depending on the date and definition used. | ||||||
Sources: Yuvraaj Hygiene Products Annual Report 2025-26 (filed with BSE on 4 September 2026), covering the Board's report, MD&A, the secretarial audit, the auditor's report and CARO annexure, and notes 1–74 of the financial statements; company BSE filings (Q3 FY26 board outcome and limited review report, 13 February 2026, read from the filed PDF; FY26 results, 28 May 2026; Q1 FY27 results, 13 August 2026; MD stake-sale disclosure, 25 August 2025; postal ballot results, 6 April 2026); FY25 directors' report and MD&A via indiainfoline.com; screener.in, indmoney, trendlyne, scanx.trade, MarketsMojo, multibagg.ai, whalesbook.com, investywise.com and 5paisa for prices and secondary summaries. All accessed 11 October 2026.
Dart Consultants is a market intelligence and technology service provider, not a SEBI-registered Investment Adviser or Research Analyst. This report is educational material only. It is not investment advice and not a recommendation to buy or sell any stock. The SELL rating is an educational device for summarising public information and one firm's own valuation, not a regulated recommendation. The FY27 scenarios, target multiples and cost-of-capital figure are Dart Consultants' own estimates. The company gives no guidance and has no broker coverage. Most company facts are taken from the FY26 annual report. Quarterly FY27 figures and some share-price data come from secondary summaries of BSE filings. Micro-cap stocks can be illiquid and extremely volatile. Readers should verify any figure before relying on it. The analyst(s) preparing this report hold no position in Yuvraaj Hygiene Products Ltd, have no relationship with the company, and have received no compensation from it.
| 12-month target | ₹6.70 |
| CMP (9 Oct 2026) | ₹9.23 |
| Implied downside | −27.4% |
| Rating | SELL |
| Market cap | ₹83.7 cr |
| P/E (TTM) | 18.5x |
| P/B | ~18.7x* |
| 52-week range | ₹3.75 – ₹17.00 |
| Shares outstanding | 9.07 cr (FV ₹1) |
| Borrowings (Mar 2026) | ₹11.6 cr† |
| Cash (Mar 2026) | ₹0.77 cr |
| Dividend | Nil |
| Listing | BSE only |
| Vishal Kampani (MD) | 33.15% |
| Benu Kampani (WTD) | 19.71% |
| FII / DII / MF | 0.00% |
| Public (7,218 holders) | 47.13% |
| FY25 | FY26 | Q1 FY27 | |
|---|---|---|---|
| Revenue | 46.26 | 38.74 | 16.21 |
| EBITDA | 6.90 | 5.65 | 2.61 |
| PAT | 5.87 | 3.31 | 1.93 |
| CFO | 5.67 | −3.09 | n/a |
*Screener.in figure (book value ₹0.49/share). Other sources show 8.0x (indmoney) and 52.6x (MarketsMojo, on FY25 book), because net worth is so small that the date and definition used change the result a lot. †₹11.0cr is an interest-free loan from the MD and ₹0.6cr is a car loan; ₹0.57cr of lease liabilities is excluded (screener's ₹12.2cr includes it).