IVP was incorporated in Mumbai in 1929 and has been part of the Allana Group since 1983. In 1965, through a collaboration with Ashland, it became the first Indian company to make foundry chemicals: the resins, binders and coatings used to make sand moulds and cores for metal casting. Since 2018 it has also sold polyurethane (PU) systems to footwear makers, and since 2019 PU laminating adhesives for flexible packaging. It has two plants, at Tarapur and Bengaluru, with 50,000 tonnes a year of capacity, more than 500 customers and 202 permanent employees. The promoter group holds 71.32%. The shares trade on the NSE and BSE.
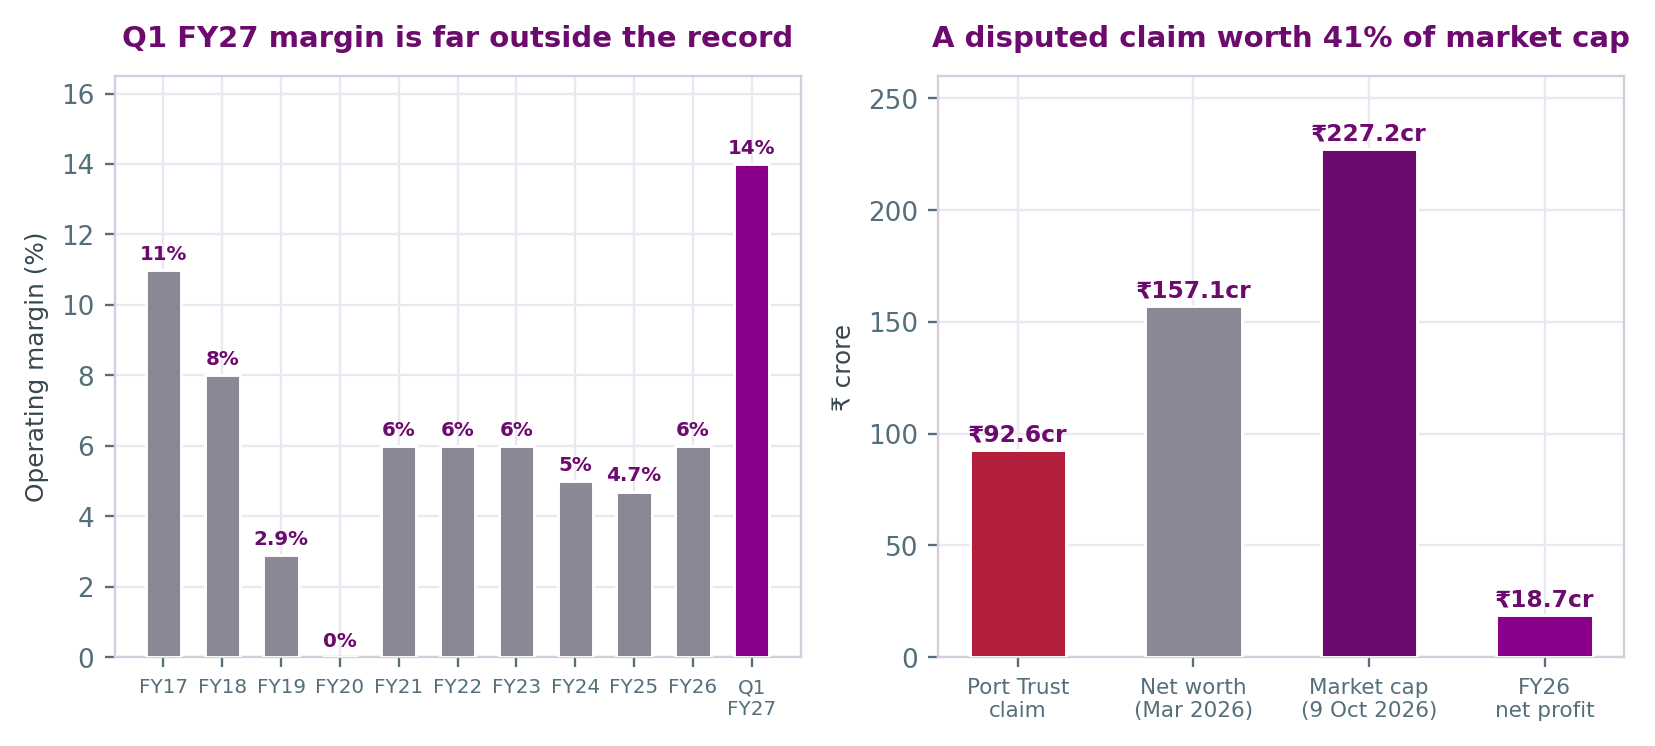
FY26 was a recovery year. Revenue rose 10.3% to ₹594.6 crore and net profit rose 65% to ₹18.7 crore. Operating cash flow swung from −₹2.5 crore to +₹52.7 crore, which paid down ₹39 crore of debt. Debt to equity fell from 0.75x to 0.42x. Then Q1 FY27 brought revenue of ₹154.7 crore (+12%), EBITDA of ₹21.7 crore at a 14.0% margin, and net profit of ₹14.0 crore. That is 75% of FY26's full-year profit in one quarter. The explanation reported is "improved product mix", "better realizations and efficient raw material procurement". At ₹220 the stock trades on 7.2x trailing earnings and 1.45x book.
The record argues for caution. Operating margin was 4.7–6% in each of FY21–FY26, and it was 2.9% or below in FY19 and FY20. Profit has swung from a loss of ₹9 crore (FY20) to ₹28 crore (FY23) and back to ₹11 crore (FY25). About 42% of revenue is spent on imports in foreign currency, and the company does not hedge commodities. Two balance-sheet items also matter. Mumbai Port Trust is claiming ₹92.6 crore in rent and interest, which IVP disputes and has not provided for; that is about ₹90 a share. And a sales employee's falsification of customer records has cost ₹6.1 crore, now fully provided.
Our rating is HOLD, with a target of ₹250 (+13.6%). Our two methods diverge widely. A P/E method that capitalises a strong FY27 at 9x gives ₹303, while a DCF that lets margins drift back toward the historical range gives ₹198. Both deduct a quarter of the port claim. The average sits a little above today's price, inside the HOLD band. H2 FY27 margins will show which method was closer.
| Mix (as disclosed) | Figure | Source |
|---|---|---|
| Reportable segments | One (chemicals) | AR Note 37 |
| Product lines | Foundry chemicals; PU systems for footwear; PU adhesives for flexible packaging; composites, insulation, refractory and powder resins | AR, Product Offerings |
| Manufactured vs traded sales, FY26 | ₹593.4cr vs ₹0.5cr | AR Note 26 |
| Export earnings / FX spent, FY26 | ₹1.5cr / ₹251.8cr | Directors' Report, Annexure B |
| Capacity | 50,000 tonnes a year (Tarapur, Bengaluru) | AR |
| Footwear vs foundry share of revenue | Not disclosed in the AR | One secondary source cites 60–65% footwear; unverified |
The company does not split revenue by product line or customer. The footwear/foundry split appears only in a secondary news summary of the Q1 FY27 results (scanx.trade), and we have not been able to verify it against a company filing.
How the money is made. IVP is a formulator. It buys resins, isocyanates, polyols and other inputs, much of them imported, and blends, reacts and packs them into products tuned to each customer's process. Gross margin after materials was about 20.7% in FY26 (19.6% in FY25), and freight alone took another 3.6% of revenue. After power, employee and other costs, about 6% is left as EBITDA in a normal year. The customers are foundries (which depend on the automotive, infrastructure and engineering cycles, and many of which are MSMEs), footwear makers and packaging converters. The MD&A itself describes these markets as fragmented, price-sensitive and facing "rising competition from low-cost players".
Moat: modest.
| Metric | Value | Read |
|---|---|---|
| Revenue CAGR | 3-yr −3% / 5-yr +15% | FY23 peak of ₹661cr; FY26 ₹595cr (+10.3%) |
| EBITDA margin (ex-other income) | 4.7% FY25 → 5.8% FY26 → 14.0% Q1 FY27 | FY21–FY26 range 4.7–6% |
| FCF conversion (FCF / PAT) | ~267% FY26 | CFO ₹52.7cr less capex ₹2.8cr = ₹49.9cr; FY25 CFO was −₹2.5cr |
| ROCE vs WACC | ~14% vs ~14%* | FY26 returns roughly equal the cost of capital; ROE 13% |
| Receivables | 113 days; 54% of assets | Credit-impaired receivables ₹24.0cr (₹5.3cr a year earlier) |
| Leverage | D/E 0.42x; interest cover 4.4x | ₹35cr of the ₹65cr of debt is deposits from Allana group companies |
| Import dependence | FX spent ≈ 42% of revenue | Forward cover on buyer's credit; no commodity hedging |
*WACC of ~14% is a Dart Consultants assumption for a BBB+-rated small cap (India Ratings IND BBB+/Stable, August 2025), not a sourced figure.
Margins. FY26's improvement from 4.7% to 5.8% came mainly from gross margin (+1.1pp) and lower bad-debt provisions. Q1 FY27's jump to 14% is a different order of magnitude. In results coverage it was put down to "improved product mix" and "better realizations and efficient raw material procurement", with no one-off items disclosed. A business that imports 42% of its revenue in raw materials can see margins widen sharply when input prices fall faster than selling prices, and narrow again when they catch up. FY23 to FY25 shows that pattern. Until H1 and H2 FY27 are reported, we treat Q1 as partly cyclical.
Cash and balance sheet. FY26 is one of the best cash years in the ten-year record we have; only FY20 (₹56 crore) was higher. It reversed FY25's −₹2.5 crore and cut debt from ₹104 crore to ₹65 crore. Part of it came from working capital moves (inventory down ₹10 crore, payables up ₹15 crore) that may not repeat. Interest on the remaining group deposits falls from 7.25% to 6.75% from April 2026.
Near-term catalysts (6–12 months)
Longer-term catalysts (2–3 years)
IVP is a mainboard company on the NSE and BSE, so the full SEBI LODR regime applies. It publishes a corporate governance report with a compliance certificate from a practising company secretary. It is a subsidiary of Allana Exports Pvt Ltd (34.31%), with the wider Allana group holding 71.32%.
Half of the six-member board is independent, and the chairman is non-executive. Related-party dealings are limited and simple: ₹35 crore of deposits from three Allana group companies at 7.25% (₹3.44 crore of interest in FY26), and small purchases (₹4.5 crore from Allanasons in FY25, almost nil in FY26). The secretarial audit is clean. The company reports no SEBI or exchange penalties in the last three years and pays a dividend (₹1.5 a share for FY26). It disclosed the fraud openly in the Directors' Report, the CARO report and the notes, with the amount and the provisioning.
There is a single executive director. The WTD & CEO's pay of ₹2.37 crore was 46x the median employee's and equal to 12.7% of FY26 net profit; it rose 13%, against 10.4% for other staff. No director holds shares in the company. The chairmanship changed in 2025, with T.K. Gowrishankar replaced by Rajkumar Lekhwani. The two longest-serving independent directors are proposed for second five-year terms, and the statutory auditor for a second term. Both are within the rules, but they reduce board refresh.
One. The fraud is a red flag for the control environment, not for the promoters. A sales employee was able to falsify customer records for long enough to cost ₹6.1 crore, and the auditor's controls opinion is accordingly qualified with the word "largely".
Any recovery on the fraud amount; whether the ECL provision keeps rising; the Bombay High Court proceedings on the port demand; and Q2–Q4 FY27 margins against Q1.
Adequate. This is a conventional, conservatively run group subsidiary with modest related-party exposure and full mainboard disclosure. The fraud reveals a weakness in sales controls, but the company disclosed it, provided for it and is fixing the controls. The bigger risks are commercial and legal, namely margin cyclicality and the port claim, rather than governance.
Multiples against peers. Prices are 9 October 2026 closes from screener.in. There is no listed company with IVP's mix. Foseco India is the nearest in foundry consumables, and Jyoti Resins and Pidilite are adhesive makers with branded, higher-margin franchises. These comparisons mainly show how much a better margin is worth. We do not suggest IVP should trade on their multiples.
| Company | Mcap (₹cr) | P/E TTM | OPM | ROCE | Latest sales | 3-yr sales CAGR |
|---|---|---|---|---|---|---|
| IVP | 228 | 7.2x | 6% (FY26) | 14.1% | 595 | −3% |
| Foseco India | 4,701 | 53.5x | 18% | 16.4% | 604 (CY25) | 14% |
| Jyoti Resins & Adhesives | 1,007 | 15.6x | 27% | 36.5% | 315 | 6% |
| Pidilite Industries | 1,50,948 | 57.0x | 24% | 31.0% | 14,601 | 7% |
| IVP at ₹220 | FY26 | TTM | FY27E (Dart base) |
|---|---|---|---|
| P/E | 12.2x | 7.2x | 6.1x (EPS ₹36.1) |
| EV/EBITDA (EV ~₹289cr) | 8.3x (₹34.7cr) | 5.7x (~₹51cr) | 5.0x (₹57.8cr) |
| P/S / P/B | 0.38x / 1.45x | — | — |
EV = market cap plus net debt of ₹62cr. TTM EBITDA = FY26 ₹34.7cr − Q1 FY26 ₹5.3cr + Q1 FY27 ₹21.7cr. We could not find a reliable source for IVP's historical average multiple. Its earnings have been too volatile for one to be very meaningful.
Method 1: forward P/E scenarios (FY27E), less a litigation haircut. FY27 margin is a full-year blend of Q1's 14% with three more normal quarters. We take D&A at ₹6.2cr, interest at about ₹6cr (lower debt, lower rate), other income at ₹4.3cr and a 25.2% tax rate, on 1.03cr shares. From each value we deduct a share of the ₹92.6cr port claim (₹89.7 a share in full). These are our assumptions.
| Scenario | FY27 rev. growth | EBITDA margin | PAT | EPS (₹) | Target P/E | Claim deducted | Value/share | vs CMP |
|---|---|---|---|---|---|---|---|---|
| Bear | 5% | 6.5% | ₹24cr | 23.7 | 6.0x | 50% | ₹97 | −55.8% |
| Base | 8% | 9.0% | ₹37cr | 36.1 | 9.0x | 25% | ₹303 | +37.7% |
| Bull | 12% | 11.0% | ₹49cr | 47.3 | 11.0x | 0% | ₹521 | +136.7% |
Bear: Q1 proves a one-off, margins fall back to around 4.5% for the rest of the year, and half the claim is lost. Base: Q1 is followed by three quarters at about 7.5%, giving a 9% year, with a modest multiple because FY27 is likely to be a high point. Bull: most of the Q1 improvement holds, and the claim is defeated. All three multiples are well below the 15–57x peer range, reflecting IVP's lower margins and ROE.
Method 2: discounted cash flow. We use a five-year forecast (FY27–FY31) with revenue growth of 8%, 7%, 7%, 6% and 6%, and EBITDA margins of 9% in FY27 and 8% in FY28, settling at 7.5%. That is above the FY21–FY26 range, giving credit for the mix improvement but not for Q1 in full. We assume capex of ₹5cr a year, a 25.2% tax rate, working capital absorbing 24% of incremental revenue (about an 88-day cycle), a 14% WACC and 5% terminal growth. We deduct net debt of ₹62cr and 25% of the port claim. The result is ₹198 per share (−10%). Free cash flow is ₹26–32cr a year, and the terminal value is 66% of EV.
| DCF value/share (₹) | g = 4% | g = 5% | g = 6% |
|---|---|---|---|
| WACC 13% | 207 | 234 | 267 |
| WACC 14% | 178 | 198 | 224 |
| WACC 15% | 154 | 170 | 190 |
| Sensitivity (base DCF) | Value per share (₹) | |||
|---|---|---|---|---|
| Long-run EBITDA margin 6% / 7.5% / 9% | 121 / 198 / 271 | |||
| Port claim deducted 0% / 25% / 50% / 100% | 221 / 198 / 176 / 131 | |||
The long-run margin assumption matters most: each 1.5pp moves value by about ₹75 a share. The bear and bull DCF cases give ₹91 and ₹313.
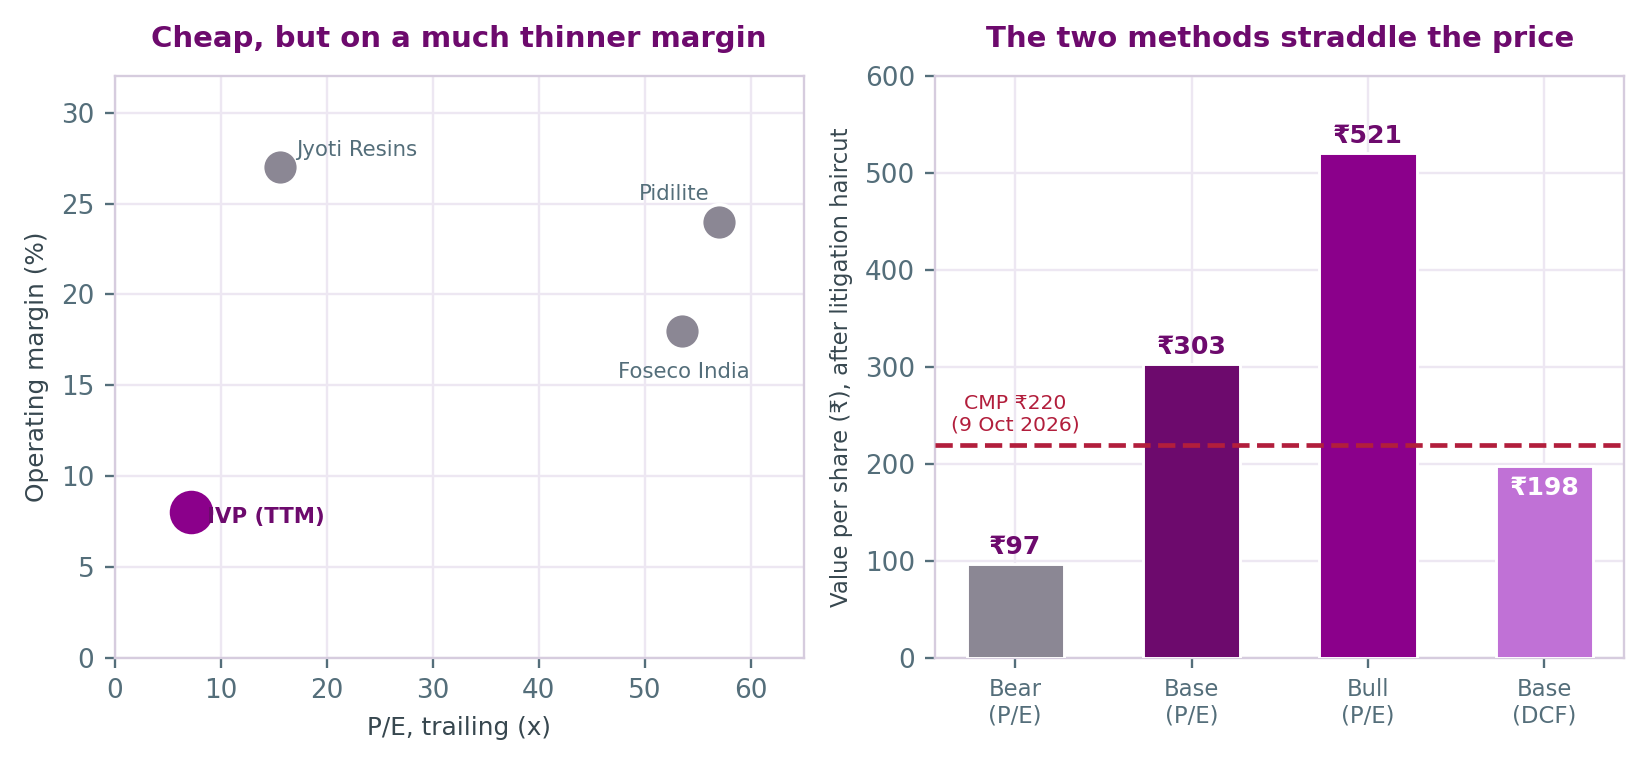
Target. The average of the two base cases (₹303 and ₹198) is ₹250, 13.6% above the current price, which is a HOLD under Dart's bands (−5% to +15%). The gap between the two methods is the same question as the investment case: whether margins have moved up for good. It should be clearer within two to three quarters.
Upgrade triggers: EBITDA margin of 10% or more in both Q2 and Q3 FY27; a favourable ruling or settlement on the port demand; recovery of a meaningful part of the fraud amount; receivable days below 100. Downgrade triggers: margin falling back below 7% in Q2 or Q3; an adverse ruling on the port demand; further fraud-related or credit-loss provisions; operating cash flow turning negative again.
| Sensitivity factor | Rough effect (Dart arithmetic) |
|---|---|
| EBITDA margin ±100bp (FY27E revenue ₹642cr) | ±₹6.4cr EBITDA → ±₹4.6 EPS → ±₹42/share at 9x |
| Target P/E ±2x | ±₹72/share on base EPS of ₹36.1 |
| Port claim, each 25% lost | −₹23.1cr → −₹22/share |
| INR 1% weaker (FX spend ₹252cr) | ~₹2.5cr higher input cost before any pass-through, about 7% of FY26 EBITDA |
| Interest rates | ₹65cr of debt: +100bp ≈ ₹0.65cr a year; buyer's credit is linked to SOFR |
| Working capital (24% of incremental revenue) | Each 10pp ≈ ₹4–5cr of FCF a year at 7–8% growth |
| FY22 | FY23 | FY24 | FY25 | FY26 | |
|---|---|---|---|---|---|
| Revenue from operations | 557 | 661 | 546 | 538.9 | 594.6 |
| Operating margin | 6% | 6% | 5% | 4.7% | 5.8% |
| Net profit | 18 | 28 | 12 | 11.3 | 18.7 |
| EPS (₹) | 17.07 | 27.13 | 11.89 | 10.96 | 18.09 |
| Cash from operations | −21 | 41 | 45 | −2.5 | 52.7 |
| Borrowings | 157 | 120 | 89 | 104.4 | 65.4 |
| Net worth | ~91 | ~118 | ~129 | 139.3 | 157.1 |
| Debtor days | 137 | 115 | 115 | 120 | 113 |
| FY25–FY26 are from the FY26 annual report. FY22–FY24 are from screener.in, with net worth approximated as reserves plus ₹10.3cr of share capital. FY26 operating margin is our ex-other-income calculation; screener rounds it to 6%. Debtor days for FY25–FY26 are the company's own MD&A figures; earlier years are from screener. Contingent liabilities at March 2026 were ₹94.5cr: the ₹92.6cr port demand, ₹1.0cr of other claims, ₹0.3cr of income-tax appeals and ₹0.6cr of bank guarantees. | |||||
Sources: IVP Ltd Annual Report 2025-26 (user-supplied, 127 pages: corporate review, MD&A, Directors' Report and annexures, Corporate Governance Report, auditor's report and CARO, financial statements and notes 1–47, AGM notice); Q1 FY27 results coverage (scanx.trade, 24 August 2026); screener.in (prices, ten-year history, quarterly results and peers, 9 October 2026 close). All accessed 11 October 2026.
Dart Consultants is a market intelligence and technology service provider, not a SEBI-registered Investment Adviser or Research Analyst. This report is educational material only. It is not investment advice and not a recommendation to buy or sell any stock. The HOLD rating is an educational device for summarising public information and one firm's own valuation, not a regulated recommendation. The FY27 scenarios, the DCF, the WACC, the margin path and the share of the port claim deducted are Dart Consultants' own assumptions, not company or brokerage forecasts. The company gives no numeric guidance. Small-cap stocks can be illiquid and volatile. Readers should verify any figure before relying on it. The analyst(s) preparing this report hold no position in IVP Ltd, have no relationship with the company, and have received no compensation from it.
| 12-month target | ₹250 |
| CMP (9 Oct 2026) | ₹220 |
| Implied upside | +13.6% |
| Rating | HOLD |
| Market cap | ₹228 cr |
| P/E (TTM / FY26) | 7.2x / 12.2x |
| P/E (FY27E, Dart base) | 6.1x |
| 52-week range | ₹110 – ₹238 |
| Book value/share | ₹152 |
| Dividend (FY26) | ₹1.5/share |
| Net debt (Mar 2026) | ₹62 cr |
| Disputed port claim | ₹92.6 cr (~₹90/share) |
| Shares outstanding | 1.03 cr (FV ₹10) |
| Promoter (Allana group) | 71.32% |
| FII / DII | 0.04% / 0.02% |
| Public (6,903 holders) | 28.62% |
| FY25 | FY26 | Q1 FY27 | |
|---|---|---|---|
| Revenue | 538.9 | 594.6 | 154.7 |
| EBITDA* | 25.2 | 34.7 | 21.7 |
| PAT | 11.3 | 18.7 | 14.0 |
| CFO | −2.5 | 52.7 | n/d |
*FY25–FY26 EBITDA excludes other income (₹4.3cr in FY26, mostly rent), calculated from the P&L. The MD&A gives ₹38.5cr and ₹28.8cr including it. The Q1 FY27 figure is as reported in results coverage.