Vikram Solar is a Kolkata-based maker of solar PV modules, founded in 2005. At March 2026 it had 9.5 GW of module capacity across Falta in West Bengal and Oragadam and Vallam in Tamil Nadu. A 6 GW plant at Gangaikondan, Tamil Nadu, produced its first module on 29 June 2026, taking capacity to 15.5 GW. The company buys its solar cells, mostly imported. It sells to independent power producers, C&I customers, government projects and, increasingly, through 119 distributors. The founding Chaudhary family holds 63% after the August 2025 IPO.
FY26 (year to March 2026) was a record. Revenue rose 40% to ₹4,802 crore on 3.3 GW of module sales. EBITDA nearly doubled to ₹917 crore, a 19.1% margin, and profit tripled to ₹470 crore. The IPO raised ₹1,500 crore of fresh money, and borrowings fell to ₹100 crore. Management guided in May for 7.5–8 GW of sales and EBITDA of ₹1,500–1,600 crore in FY27.
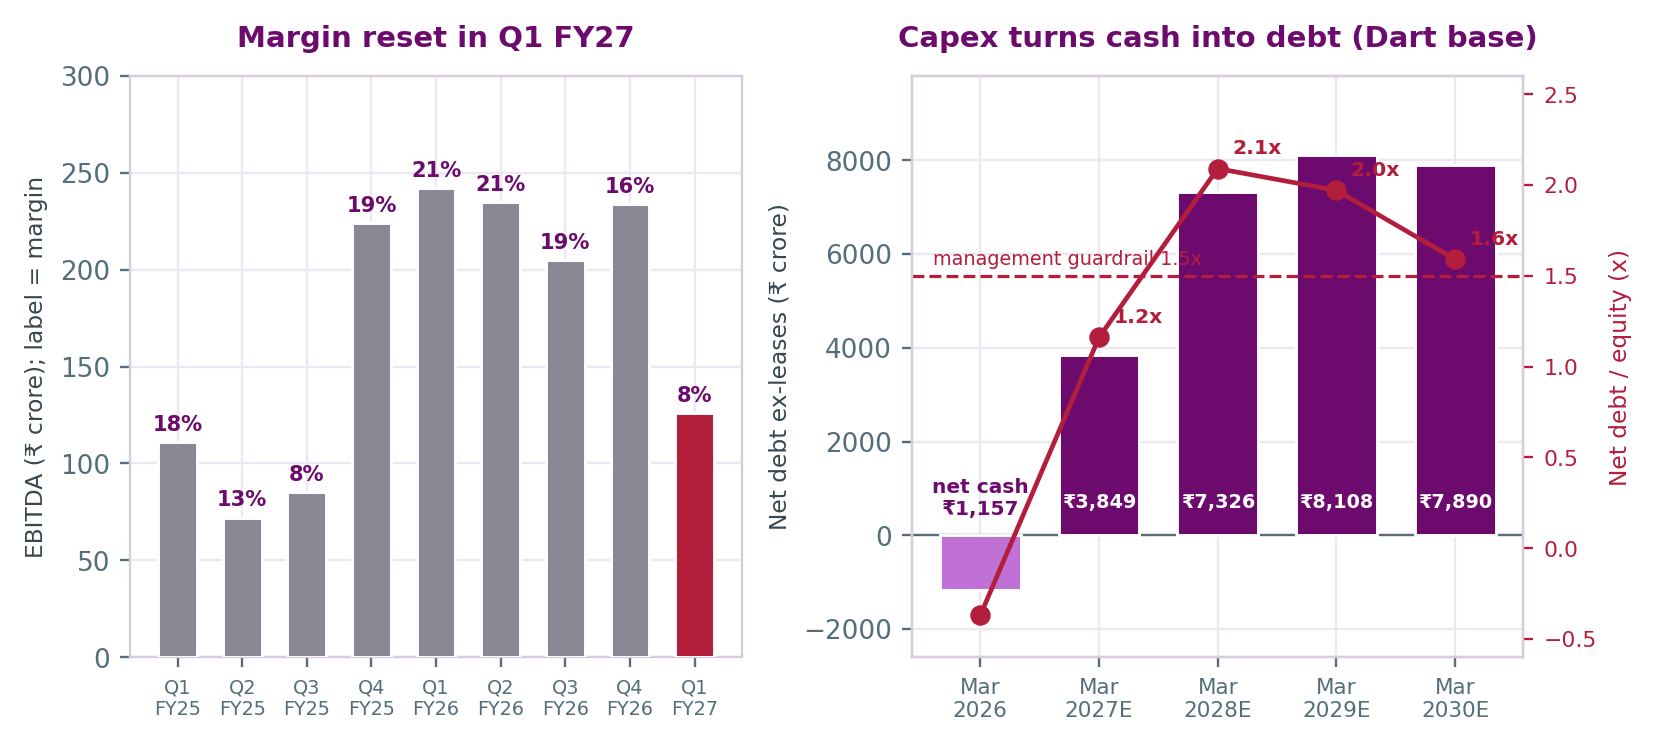
Q1 FY27 went the other way. Volumes held at about 1 GW and revenue rose 38%, but EBITDA fell 48% to ₹126 crore, an 8% margin, and profit fell 85% to ₹20 crore. Management gave three reasons. The new cell rule (ALMM List-II) froze buying for most of the quarter. Metal and crude-linked inputs rose with the Gulf conflict. And so much new module capacity has come on stream across the industry that costs could not be passed on. The FY27 guidance is now "under review" until the H1 results. The stock fell 10% on results day and closed at ₹147 on 14 October, near its low and 56% below the IPO price.
Our rating is HOLD. We value the business on a ₹/watt basis through the cell ramp-up. An EV/EBITDA method on FY29 gives ₹162 and a DCF gives ₹144; the average is ₹153, which we round to ₹155. Brokers that published after Q1 have targets of ₹215–219, and the Bloomberg consensus was ₹260 in August. We are well below them. The capex plan pushes net debt above management's own limit before the cell plant can earn a return.
| Operating data | FY25 | FY26 | Q4 FY26 | Q1 FY27 |
|---|---|---|---|---|
| Module sales volume (MW) | ~1,900 | 3,342 | ~1,000 | 1,006 |
| Revenue (₹ cr) | 3,423 | 4,802 | 1,453 | 1,563 |
| Revenue per watt (₹) | ~18.0 | 14.4 | ~14.0 | 15.02 |
| EBITDA per watt (₹) | ~2.6 | 2.74 | ~2.3 | 1.25 |
| EBITDA margin | 14.4% | 19.1% | 16% | 8.1% |
| Installed module capacity (GW) | 4.5 | 9.5 | 9.5 | 15.5 |
| Order book (GW) | — | 8.2 | 8.2 | 7.9 |
Sources: FY26 annual report, Q4 FY26 and Q1 FY27 earnings calls, screener.in. Figures marked ~ are Dart arithmetic from rounded disclosures (FY25 volume "1.9 GW"; Q4 dispatch "approximately 1 GW"). Q1 FY27 per-watt figures are as stated by the CFO. Services (EPC, O&M) were under 2.5% of FY26 revenue.
How the money is made. Vikram buys cells and other materials, assembles them into modules and sells them by the watt. Raw materials are about 70% of revenue (₹3,403 crore of ₹4,802 crore in FY26). The margin is the gap between the module price and the cost of cells, glass, aluminium frames, ribbon and EVA encapsulant. About 80% of the order book has a clause that passes changes in cell prices to the customer. Other materials are not covered, and that is where Q1's ₹1.86 a watt cost increase came from: metals are about 35% of non-cell materials and EVA about 12%, per the CFO. The order book at June was 7.9 GW. About 7.1 GW of it is large-account business, which the CFO said is "entirely non-DCR"; distribution sales are not counted in the order book. In May the March book was split 69% IPPs, 13% C&I and 18% government and EPC.
Moat: some brand and bankability, little pricing power.
| Metric | Value | Read |
|---|---|---|
| Revenue CAGR, FY23–FY26 | 32% | ₹2,073cr → ₹4,802cr (screener); volume did the work, prices per watt fell |
| EBITDA margin path | 9% → 16% → 14% → 19% → 8% | FY23, FY24, FY25, FY26, Q1 FY27; FY22 was 3.4% with a loss |
| FCF (CFO − capex) | −₹93cr FY26 | CFO ₹630cr, capex ₹722cr; Q1 FY27 capex alone was ~₹500cr |
| ROE / ROCE | 21.3% / 24.1% | FY26 per the company, on an equity base that more than doubled with the IPO |
| Working capital | 82 → 44 days | Net cycle, FY25 to FY26 (CFO); receivables still ₹1,214cr, about 92 days |
| Net cash | ₹1,157cr (Mar 2026) | Of which ₹962cr is unspent IPO money in deposits; plus ₹545cr of leases |
| Capex plan | ~₹5,000cr in FY27 | Cells (₹5,400cr for 12 GW in the May plan), wafer-ingot (9 GW, ₹5,600cr), BESS; mostly debt |
Sources: FY26 annual report (MD&A key ratios, cash flow statement, note 70 on IPO proceeds); Q4 FY26 and Q1 FY27 calls; screener.in. FCF is Dart arithmetic.
Margins. The FY26 margin was real, but it rested on things that have since changed. In FY26 Vikram bought imported cells at low prices and sold modules into a market where demand still exceeded supply. Q4 FY26 already showed the turn: per-watt revenue rose ₹0.60 but costs rose ₹0.80, so margin slipped to 16%. In Q1 FY27 costs rose another ₹1.86 a watt and very little of it was passed on. Management calls most of the increase "transitory" and expects DCR modules and distribution to lift the blend. That may be right for metals and EVA. The overcapacity is not transitory, and cell prices will matter until the company has its own cells. Our base case uses ₹1.45 a watt for FY27 as a whole: ₹1.25 in Q1, improving to about ₹1.5 for the rest of the year.
Cash and capex. FY26 operating cash flow was ₹630 crore, roughly matched by ₹722 crore of capex. The IPO money went into deposits, and those deposits are now being spent. Management plans about ₹5,000 crore of capex in FY27 and says the debt drawdown would start "somewhere in the end of" August. A rule of thumb from the May call is ₹600 crore a gigawatt for wafer-ingot. For FY28 we assume ₹4,000 crore, mainly wafer-ingot, because the company has not given a figure. The company's guardrails are interest and debt-service cover above 2.5x and net debt below 1.5x equity at peak. On our base case FY28 interest cover is about 2.8x, but net debt reaches 2.1x equity.
Returns. The 21% FY26 ROE will not hold through the build. On our numbers FY27 profit is about ₹147 crore (EPS ₹4.0) and FY28 about ₹192 crore (EPS ₹5.3). Depreciation and interest on the new plants arrive before the plants are fully loaded. ROE is around 4–6% in those two years. It recovers only in FY29, when the cell plant runs for a full year.
Near-term catalysts (6–12 months)
Longer-term catalysts (2–3 years)
Vikram Solar is a Companies Act company listed on the NSE and BSE since 26 August 2025, so the full SEBI LODR framework applies. Its products fall under MNRE's ALMM lists and BIS standards. Customs duties and safeguard duties on cells come under the finance ministry and DGTR, and its EPC contracts carry liquidated-damages clauses enforced through arbitration. Its US business is exposed to US trade remedies.
The statutory auditors (GARV & Associates, appointed until 2028) gave an unmodified opinion on both standalone and consolidated accounts. Under CARO they found no defaults to lenders, no fraud and no whistle-blower complaints. IPO money is tracked by India Ratings as monitoring agency, and the company reports no deviation from the stated objects. Of the ₹1,414.5 crore net proceeds, ₹962 crore was unspent at March and held in bank deposits. Both rating agencies upgraded the company in FY26, India Ratings to IND A+ and Acuité to A+. Contingent liabilities fell from ₹258 crore to ₹62 crore. Half the board of eight is independent, and the board met ten times. The annual report is candid about the near-term outlook: the MD&A warns of "a compression in standalone module profitability" and of "emerging domestic overcapacity".
Related-party flows are large, as described above, and the duties reimbursement to VSL Logistics needs a plain explanation. The Chairman and Managing Director, Gyanesh Chaudhary, was paid ₹9.05 crore in FY26, up 31% from ₹6.89 crore, in a year when the company paid no dividend. Promoters were reimbursed ₹29.1 crore of IPO costs for their share of the offer for sale. That is normal practice. The founder's own holding fell by 60 lakh shares during the year, which is consistent with his sale in the offer. Senior management has turned over quickly. Between April 2024 and March 2026 the CFO role changed hands twice and the CEO role twice, including an interim CEO. Sameer Nagpal became CEO only in March 2026. Two company flats are still not registered in its name.
None in the audit opinion, but two items to track. The first is the disputed ₹201 crore of receivables covered by the Emphasis of Matter. If either case goes against the company it is a write-off, not a cash outflow, but the safeguard-duty case has been running since 2018. The second is the size and trend of payments to promoter companies, which rose faster than revenue in FY26.
The outcome of the safeguard-duty litigation; the nature of the VSL Logistics duties reimbursement; how the project debt is structured and whether equity is raised; any further change in the CEO or CFO role; and how the remaining ₹962 crore of IPO money is spent against the stated projects.
Adequate, with promoter-related flows that need more explanation. The accounts are clean and the disclosures are full enough to raise these questions. That counts for something. The issues are a concentrated promoter group, large and growing transactions with promoter-owned service companies, and two old disputes that together equal 43% of last year's profit. None of these is a reason to avoid the stock on its own. They are reasons for a higher cost of capital.
Multiples against peers. All prices are 14 October 2026 closes from screener.in. Market cap to FY26 EBITDA does not adjust for net cash or debt, because we could not source peer net debt consistently. Vikram's own EV-based figures are shown separately. Peers' latest-quarter margins are shown where screener reported them.
| Company | Mcap (₹cr) | P/E TTM | P/B | Mcap / FY26 EBITDA | FY26 OPM | Latest qtr OPM | ROE |
|---|---|---|---|---|---|---|---|
| Vikram Solar | 5,318 | 14.7x | 1.68x | 5.8x | 19% | 8% (Jun-26) | 21.4% |
| Waaree Energies | 72,551 | 18.0x | 5.01x | 12.3x | 22% | 18% (Jun-26) | 32.5% |
| Premier Energies | 42,179 | 25.3x | 9.71x | 17.7x | 30% | — | 41.0% |
| Emmvee Photovoltaic | 20,708 | 16.2x | 5.60x | 11.9x | 34% | 35% (Jun-26) | 50.7% |
| Saatvik Green Energy | 5,133 | 20.6x | 3.77x | 9.5x | 12% | 6.7% (Mar-26) | 42.3% |
Screener figures. FY26 OPM is FY26 operating profit divided by sales. Screener did not show a June 2026 quarter for Premier or Saatvik in our pull. Peer ROEs are high partly because several listed recently with small pre-IPO equity bases.
| Vikram multiples at ₹147 | FY26 (actual) | FY27E (Dart base) | FY28E (Dart base) | FY29E (Dart base) |
|---|---|---|---|---|
| P/E | 10.8x (EPS ₹13.60) | 36.4x (EPS ₹4.0) | 27.7x (EPS ₹5.3) | 8.8x (EPS ₹16.6) |
| EV/EBITDA | 4.5x (EV ₹4,161cr) | 14.6x (EV ₹9,719cr) | 8.5x (EV ₹13,197cr) | 5.5x (EV ₹13,979cr) |
| P/B | 1.68x | 1.61x | 1.52x | 1.30x |
Forward EV uses today's market cap plus Dart's estimated year-end net debt and ₹545cr of leases. FY26 EV uses March 2026 net cash and excludes leases. All forward figures assume no new equity.
Our base case. We forecast in watts, because that is how the business is run and how management reports it. Sales volumes are 4.6 GW in FY27, 6.5 GW in FY28 and 8.5 GW in FY29, rising to 12.5 GW by FY33. FY27 is well below the 7.5–8 GW guided in May. Q1 was 1 GW, and management would not confirm the full-year number. EBITDA per watt is ₹1.45 in FY27 and ₹2.40 in FY28, when the cell plant runs at partial load. It is ₹3.00 in FY29–FY30, once the cells are fully used, and then fades to ₹2.50 by FY33 as competition returns. Revenue per watt is ₹15–16. Capex is ₹5,200 crore in FY27, ₹4,000 crore in FY28 and ₹2,000 crore in FY29, then about ₹800 crore a year. Interest is 9% on net debt. Tax is 25.2%. We include no battery-storage earnings and no battery-cell capex, because the company has not costed the cell plant. All of these are Dart assumptions.
Method 1: EV/EBITDA on FY29. FY29 is the first year in which the cell plant can run for a full year, so it is the first year whose EBITDA reflects the business being built. We apply 6x to FY29E EBITDA of ₹2,550 crore. That is close to the 5.3x PL Capital used on March 2028 EBITDA in May, and well below integrated peers (12–18x trailing market cap to EBITDA). It gives an EV of ₹15,300 crore. Less FY29E net debt of ₹8,108 crore and ₹545 crore of leases, that is ₹183 a share, or ₹162 discounted back one year at 13%.
| Scenario | Volume FY27 / FY28 / FY29 (GW) | EBITDA/W FY27 / FY28 / FY29 (₹) | FY29E EBITDA | FY29E EPS (₹) | Peak net debt / equity | Multiple · WACC | Value/share | vs CMP |
|---|---|---|---|---|---|---|---|---|
| Bear | 4.2 / 5.5 / 7.0 | 1.25 / 1.60 / 2.30 | 1,610 | 5.6 | 1.8x | 5x · 14% | ₹32 | −78% |
| Base | 4.6 / 6.5 / 8.5 | 1.45 / 2.40 / 3.00 | 2,550 | 16.6 | 2.1x | 6x · 13% | ₹153 | +4% |
| Bull | 5.0 / 7.5 / 9.5 | 1.70 / 2.70 / 3.20 | 3,040 | 27.7 | 1.8x | 7x · 12.5% | ₹318 | +117% |
Each value is the average of Method 1 and Method 2 under that scenario. In the bear case margins stay near today's level for two years, the integrated margin settles at ₹2.0–2.5 a watt because of overcapacity, and the company defers most of the wafer-ingot spend (FY28 capex ₹1,500cr). Even so, debt taken on in FY27 weighs on an equity base of about ₹3,300cr. The range is this wide because the company is moving from net cash to about 2x net debt to equity. Small changes in the margin per watt become large changes in equity value.
Method 2: discounted cash flow. We discount free cash flow to the firm from FY27 to FY33 at 13%, with 4% terminal growth. The 13% is higher than for a large company to reflect cyclicality, execution risk on three new plants and the related-party issues. Free cash flow is about −₹4,900 crore in FY27 and −₹3,100 crore in FY28, roughly breakeven in FY29, and ₹1,600–1,700 crore a year from FY31. The present value of the explicit period is negative, about −₹1,980 crore, so the terminal value is more than all of the EV. We show this openly because it means the DCF depends entirely on what the business earns after the build. EV is about ₹7,100 crore. Less estimated net debt at the valuation date and leases, that is ₹144 a share (−2%).
| DCF value/share (₹) | g = 3% | g = 4% | g = 5% |
|---|---|---|---|
| WACC 12% | 159 | 195 | 240 |
| WACC 13% | 116 | 144 | 178 |
| WACC 14% | 82 | 103 | 129 |
The DCF reaches the lowest post-Q1 broker target (₹215) only with a WACC of 12% and growth near 5%. The bear and bull DCF values on the same assumptions as the scenario table are ₹16 and ₹310.
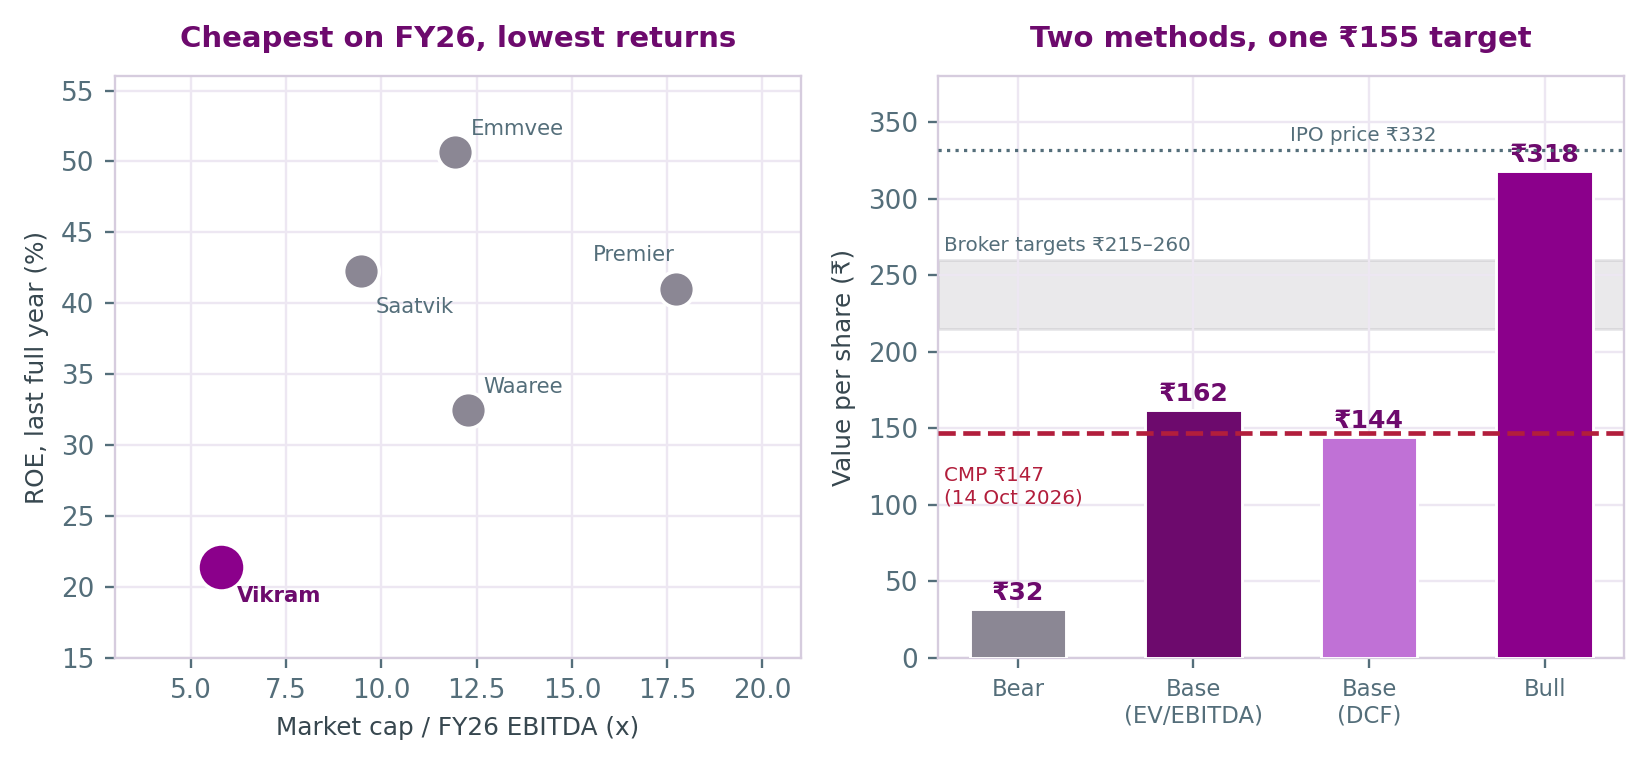
Target. The simple average of the two base cases (₹162 and ₹144) is ₹153, which we round to ₹155, 5.4% above the current price. The two methods are close because both depend on the same thing: whether the company earns about ₹3 a watt once its cells are running. Under Dart's rating bands, +5.4% is a HOLD (between −5% and +15%). A rise above about ₹163 would make it a SELL at the same target, and a fall below about ₹135 would make it a BUY. The width of the scenario range matters more than the precise target. This is a stock where the outcome depends on execution over the next 18 months, not on the multiple.
What would make us more positive: H1 results with Q2 EBITDA back above ₹2 a watt; the 9 GW cell line commissioned in Q4 FY27 as promised; project debt raised without new equity, or equity raised at a price well above today's; a clear explanation of the VSL Logistics reimbursements; or a favourable safeguard-duty ruling. What would make us more negative: a cut in FY27 volume guidance below 4.5 GW; a delay in the cell plant beyond Q1 FY28; capex rising without a matching rise in the order book; larger related-party flows; or cancellation of the US export orders.
A HOLD can be wrong in either direction. These are the three risks most likely to make it wrong, followed by the variables that move the numbers most.
| Sensitivity factor | Rough effect (Dart arithmetic) |
|---|---|
| EBITDA per watt ±₹0.25 (FY29 onwards) | Method 1 ₹127 / ₹198; DCF ₹94 / ₹193 → average about ±₹42 |
| EV/EBITDA multiple ±1x (Method 1) | ₹100 at 5x / ₹225 at 7x (base ₹162) |
| WACC ±100bp (DCF) | −₹41 / +₹51 per share |
| Cell plant two quarters late | FY28 EBITDA/W ₹1.60, FY29 ₹2.60 → Method 1 ₹94, DCF ₹130 |
| Equity raise to hold net debt / equity at 1.5x | ~₹826cr, about 15% dilution at ₹147 |
| Safeguard duty and LD disputes lost | Up to ₹201cr write-off (₹155cr net of ₹46cr customer recovery) → ₹4–6 per share |
| Interest rate ±100bp on project debt | About ±₹80cr of FY29 interest on ~₹7,900cr of average net debt → about ±₹1.6 of EPS |
| FY23 | FY24 | FY25 | FY26 | Q1 FY27 | |
|---|---|---|---|---|---|
| Revenue from operations | 2,073 | 2,511 | 3,423 | 4,802 | 1,563 |
| EBITDA (ex other income) | 187 | 399 | 492 | 917 | 126 |
| EBITDA margin | 9.0% | 15.9% | 14.4% | 19.1% | 8.1% |
| Net profit (PAT) | 14 | 80 | 140 | 470 | 20 |
| EPS (₹, diluted) | — | — | 4.60 | 13.60 | 0.55 |
| Cash from operations | 195 | 152 | 281 | 630 | — |
| Capex | — | — | 133 | 722 | ~500 |
| Borrowings (ex leases) | — | — | 231 | 100 | — |
| Total equity | 365 | 446 | 1,242 | 3,168 | — |
| Module sales (GW) | — | — | ~1.9 | 3.34 | 1.01 |
| FY25–FY26 figures are from the FY26 annual report (₹ million converted to ₹ crore). FY23–FY24 and Q1 FY27 figures are from screener.in. FY23–FY24 equity is screener's equity capital plus reserves. Screener's FY25 revenue (₹3,415cr) and CFO (₹290cr) differ slightly from the annual report (₹3,423cr; ₹281cr) because of regrouping. FY26 PAT includes a ₹5.6cr exceptional charge. Q1 FY27 capex is the CFO's approximate figure from the earnings call. Dashes mark figures not available in the sources we used. | |||||
Sources: Vikram Solar Annual Report 2025-26 (Directors' Report, MD&A, Corporate Governance Report, independent auditors' reports and CARO, consolidated financial statements and notes 44, 47, 57, 58 and 70); Q4 FY26 earnings call transcript (8 May 2026, NSE); Q1 FY27 earnings call transcript (7 August 2026, filed with BSE on 13 August 2026); screener.in (prices, quarterly data and peers, 14 October 2026 close); MNRE office memorandum of 18 July 2026 on ALMM List-II; Business Today (Q1 broker reactions, 7 August 2026); TradingView/Moneycontrol (PL Capital note); IPO data from the annual report and Business Standard. All accessed 14 October 2026.
Dart Consultants is a market intelligence and technology service provider, not a SEBI-registered Investment Adviser or Research Analyst. This report is educational material only. It is not investment advice and not a recommendation to buy or sell any stock. The HOLD rating is an educational device for summarising public information and one firm's own valuation, not a regulated recommendation. Several figures here, including the FY27–FY33 volume and per-watt EBITDA forecasts, the capex phasing after FY27, the net debt path, the DCF, the WACC and the EV/EBITDA multiple, are Dart Consultants' own estimates built from public information. They were not disclosed by the company or forecast by any brokerage, and they should be read as one firm's reasoning, not as certain. Where sources disagreed, we have shown the disagreement rather than choosing one number without saying so. Readers should verify any figure before relying on it. The analyst(s) preparing this report hold no position in Vikram Solar Ltd, have no banking, advisory or brokerage relationship with the company, and have received no compensation from it.
| 12-month target | ₹155 |
| CMP (14 Oct 2026) | ₹147 |
| Implied upside | +5.4% |
| Rating | HOLD |
| Market cap | ₹5,318 cr |
| P/E (FY26 / TTM) | 10.8x / 14.7x |
| P/B (BV ₹87.6) | 1.68x |
| 52-week range | ₹141 – ₹355 |
| IPO price (Aug 2025) | ₹332 |
| Net cash (Mar 2026)* | ₹1,157 cr |
| Dividend (FY26) | Nil |
| Shares outstanding | 36.23 cr |
| Promoter & group | 63.05% |
| Mutual funds / AIFs | 4.52% |
| FPIs | 2.94% |
| Resident individuals | 21.68% |
| FY25 | FY26 | Q1 FY27 | |
|---|---|---|---|
| Revenue | 3,423 | 4,802 | 1,563 |
| EBITDA | 492 | 917 | 126 |
| PAT | 140 | 470 | 20 |
Consolidated. *Cash and deposits less borrowings; excludes ₹545cr of leases.